Section: Dashboard | Biotope - Cumulative IMPacts of invasive ALien species (CIMPAL) version | LifeWatch ERIC Training Platform

Main course page
  • Biotope - Cumulative IMPacts of invasive ALien species (CIMPAL) version

    What this tutorial is about
    This tutorial will guide you during the use of the CIMPAL (Cumulative IMPacts of invasive ALien species) version of the Biotope vulnerability Workflow, which assesses the habitat vulnerability to the introduction and establishment of Invasive Alien Species (IAS) and the cumulative effects of their negative impacts. The tutorial will clarify how to prepare the input data, as well as the step-by-step use of the workflow.

    About the workflow
    You can access the workflow through My Lifewatch Platform at  https://my.lifewatch.eu under LifeWatch ERIC Products/ LifeWatch VREs/ Biotope/  Run a new workflow/ CIMPAL.
    For further information regarding the overall initiative that leaded to the design of the validation cases and the development of the workflows, please consult  the LifeWatch Internal Joint Initiative dedicated platform: https://www.lifewatch.eu/internal-joint-initiative/workflows/.

    Get in touch with the scientific team

    Heliana TeixeiraHeliana Teixeira, CESAM Centre for Environmental and Marine Studies, Biology Department, University of Aveiro


    Julien RadouxJulien Radoux, UCLouvain 


Dashboard

  • Dashboard

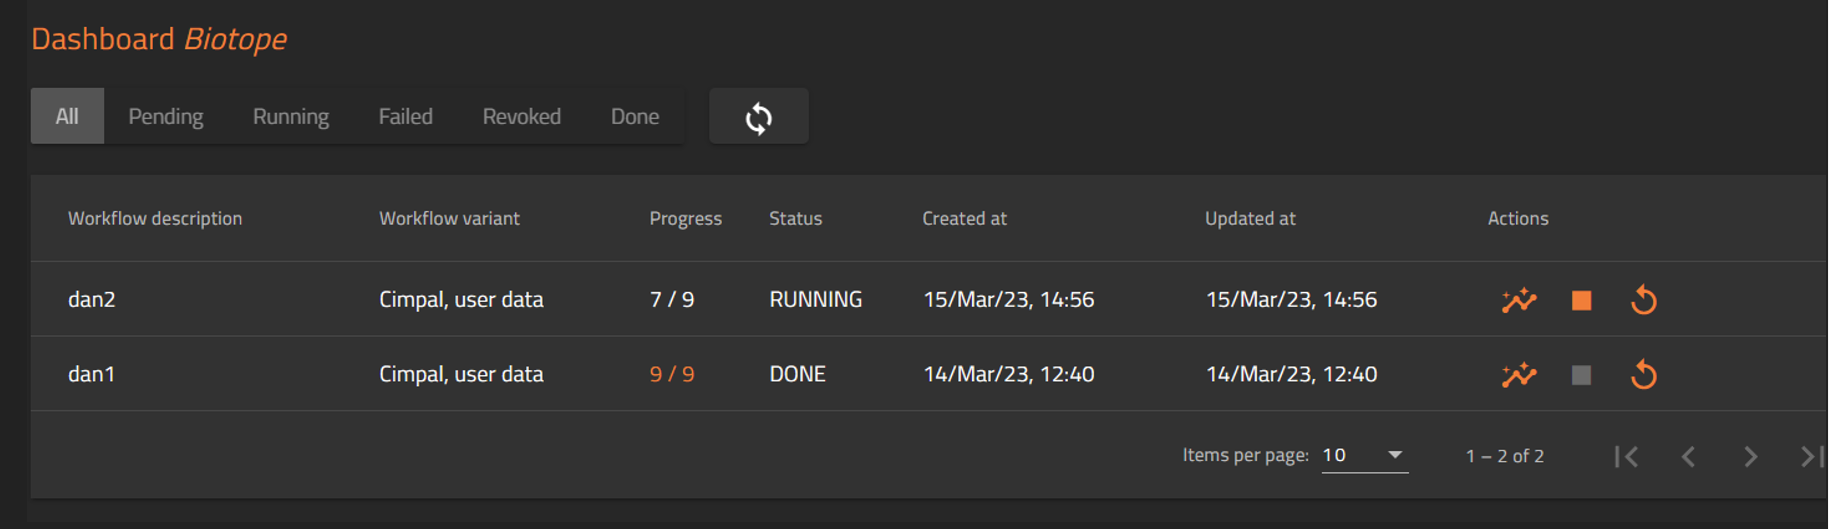
    In your Dashboard (Fig. 12) you can find all your workflows and their status. More detail can be found under the Actions column, by pressing the Detailed information icon (Fig. 13), which will route you to the workflow insight.

    dashboard biotope cimpal

    Fig. 12. Dashboard for the Biotope workflow

    icon

    Fig. 13. Detailed information icon

    ATTENTION:
    1. The running time is highly dependent on the resolution defined in the Grid size value, on the number of species and on the size area of the assessment. As reference, running a dataset with 64 IAS for all Mediterranean sea, at a 100 m resolution, could take as much as 18 hours to complete. If not indicated, the default Grid size value is set to 25 m.

    Workflow insight

    Here you will find four panels:

    1. General information will include several information regarding the workflow;
    2. Workflow status diagram gives you a visual depiction of the status of the workflow and individual services;
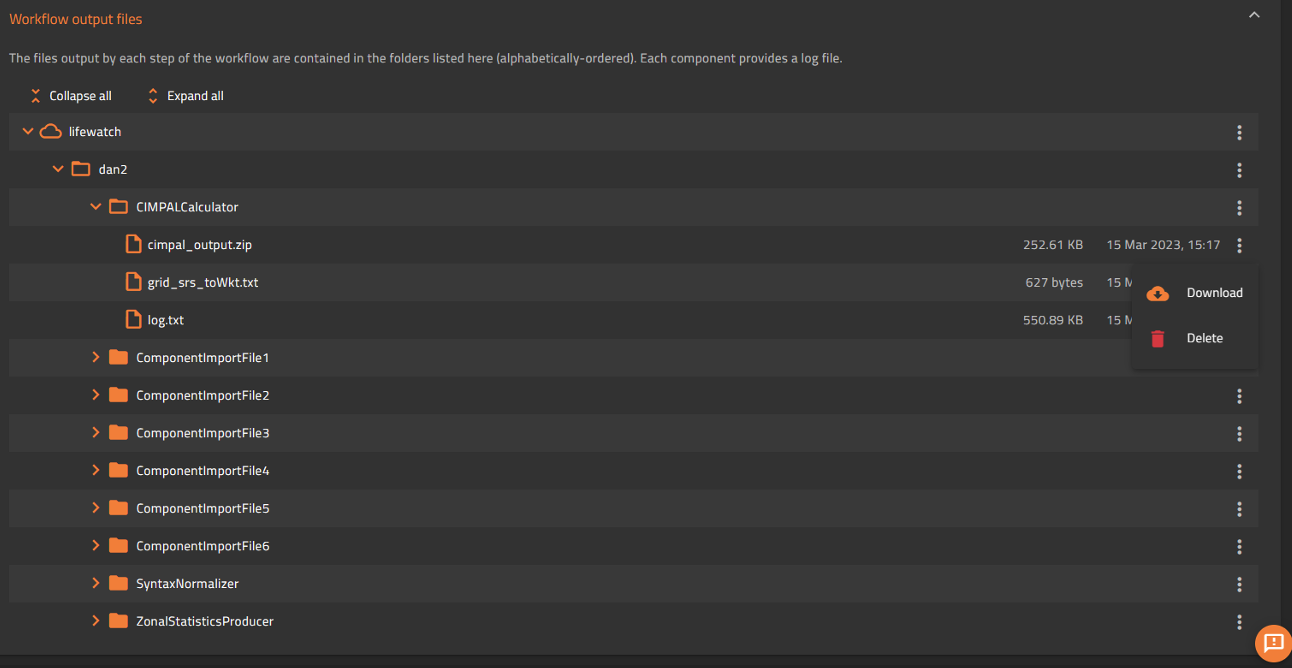
    3. Workflow output files (Fig. 13), where you can find the individual outputs for each component of the workflow, as well as their log files. This panel allows you to retrieve the results for all calculations:
      • Within the ‘CIMPALCalculator’ folder you will find ‘cimpal_output.zip’ which includes the individual raster outputs with the CIMPAL value for each species and path of introduction. The overall CIMPAL raster file will include ‘_ALL_’ in the name (e.g. cimpal_ALL_Weights_Precautionary.tif). The files should be downloaded to your local file, extracted and opened with a GIS software (e.g. QGIS)
      • Within the ‘ZonalStatisticProducer’ folder you will find individual (species and path of introduction) .csv files with the statistics of CIMPAL for each zone previously defined. The overall CIMPAL statistics file will include ‘_ALL_’ in the name (e.g. cimpal_ALL_Weights_Precautionary_stat.csv). The files can be open in any text or spreadsheet software.
      To access each file, press the three vertical dots at the end of the respective line on the expanded file list, and choose ‘Download’ as, shown in Fig. 14;

    output file panel

    Fig. 14. Workflow output files panel, where the user can access the final results, as well as the individual outputs for each component of the workflow.

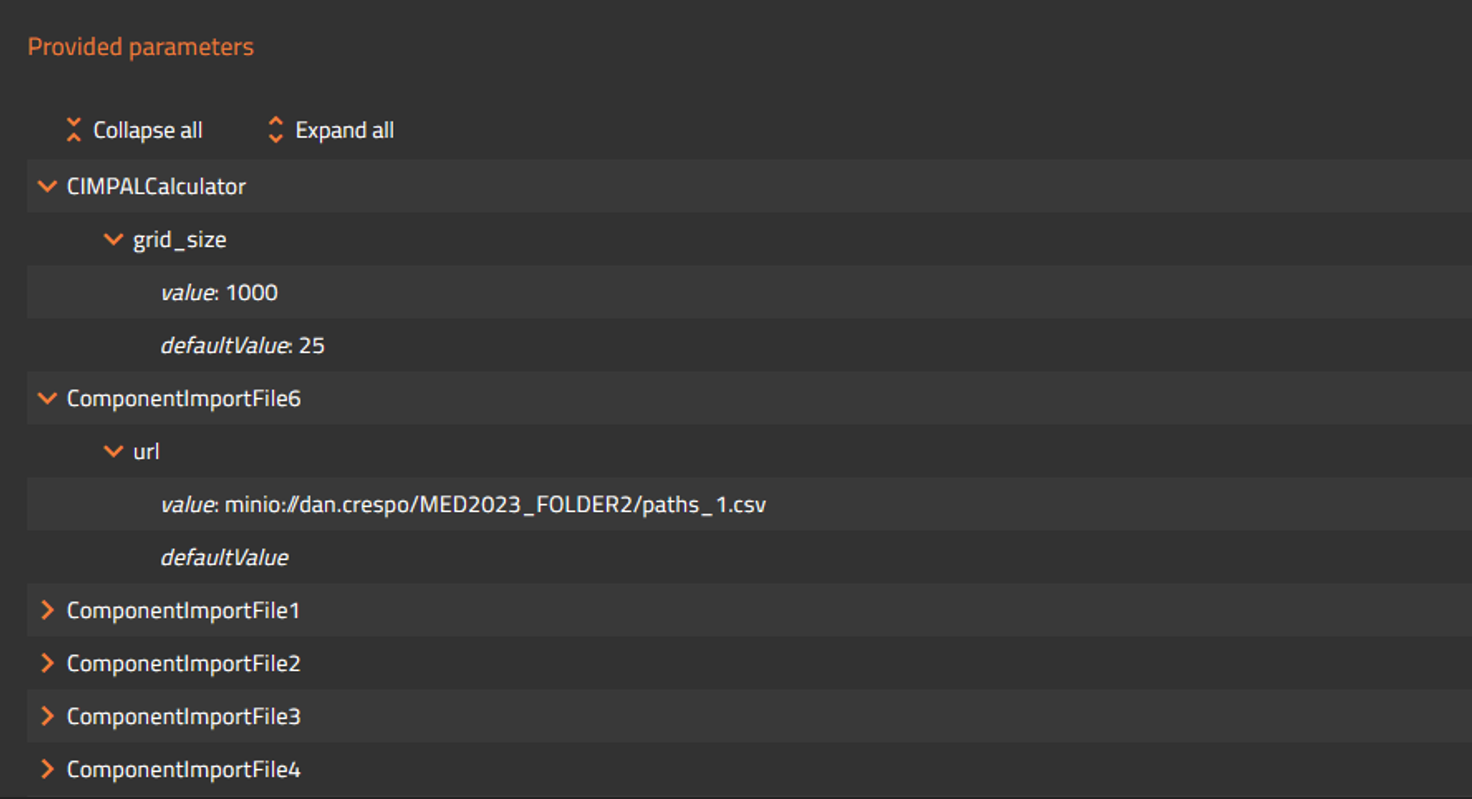
    4. Provided parameters (Fig. 15)  identifies the parameters and the paths to the input files in each component.

    parameters panel

    Fig. 15. Provided parameters panel, where the user can identify the input parameters and files used in each component/step.