LifeWatch Italy Phyto VRE: Atlas of Species and Shapes
Section outline
-
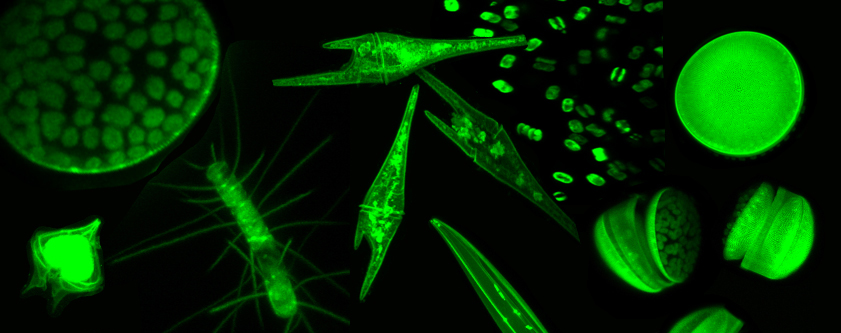
Phytoplankton plays an important role in aquatic ecosystems as it accounts for most of global primary production and affects the biogeochemical processes, trophic dynamics and biodiversity architecture.
LifeWatch Italy, one of the ERIC's national nodes, designed the Phytoplankton Virtual Research Environment (Phyto VRE) to support researches on phytoplankton guilds and their relative structure, organization and ecological function. The Phyto VRE services, in fact, enable researchers to analyse and process phytoplankton data at a level of resolution from individual cells to whole guilds. In particular, the Atlas of Phytoplankton and the Atlas of Shapes provide harmonised data on taxonomy and morphological and demographic traits.
This resource illustrates how to access, navigate and use these two services of the LifeWatch Italy Phyto VRE.
-
Click on the image to visit the Atlas of Phytoplankton
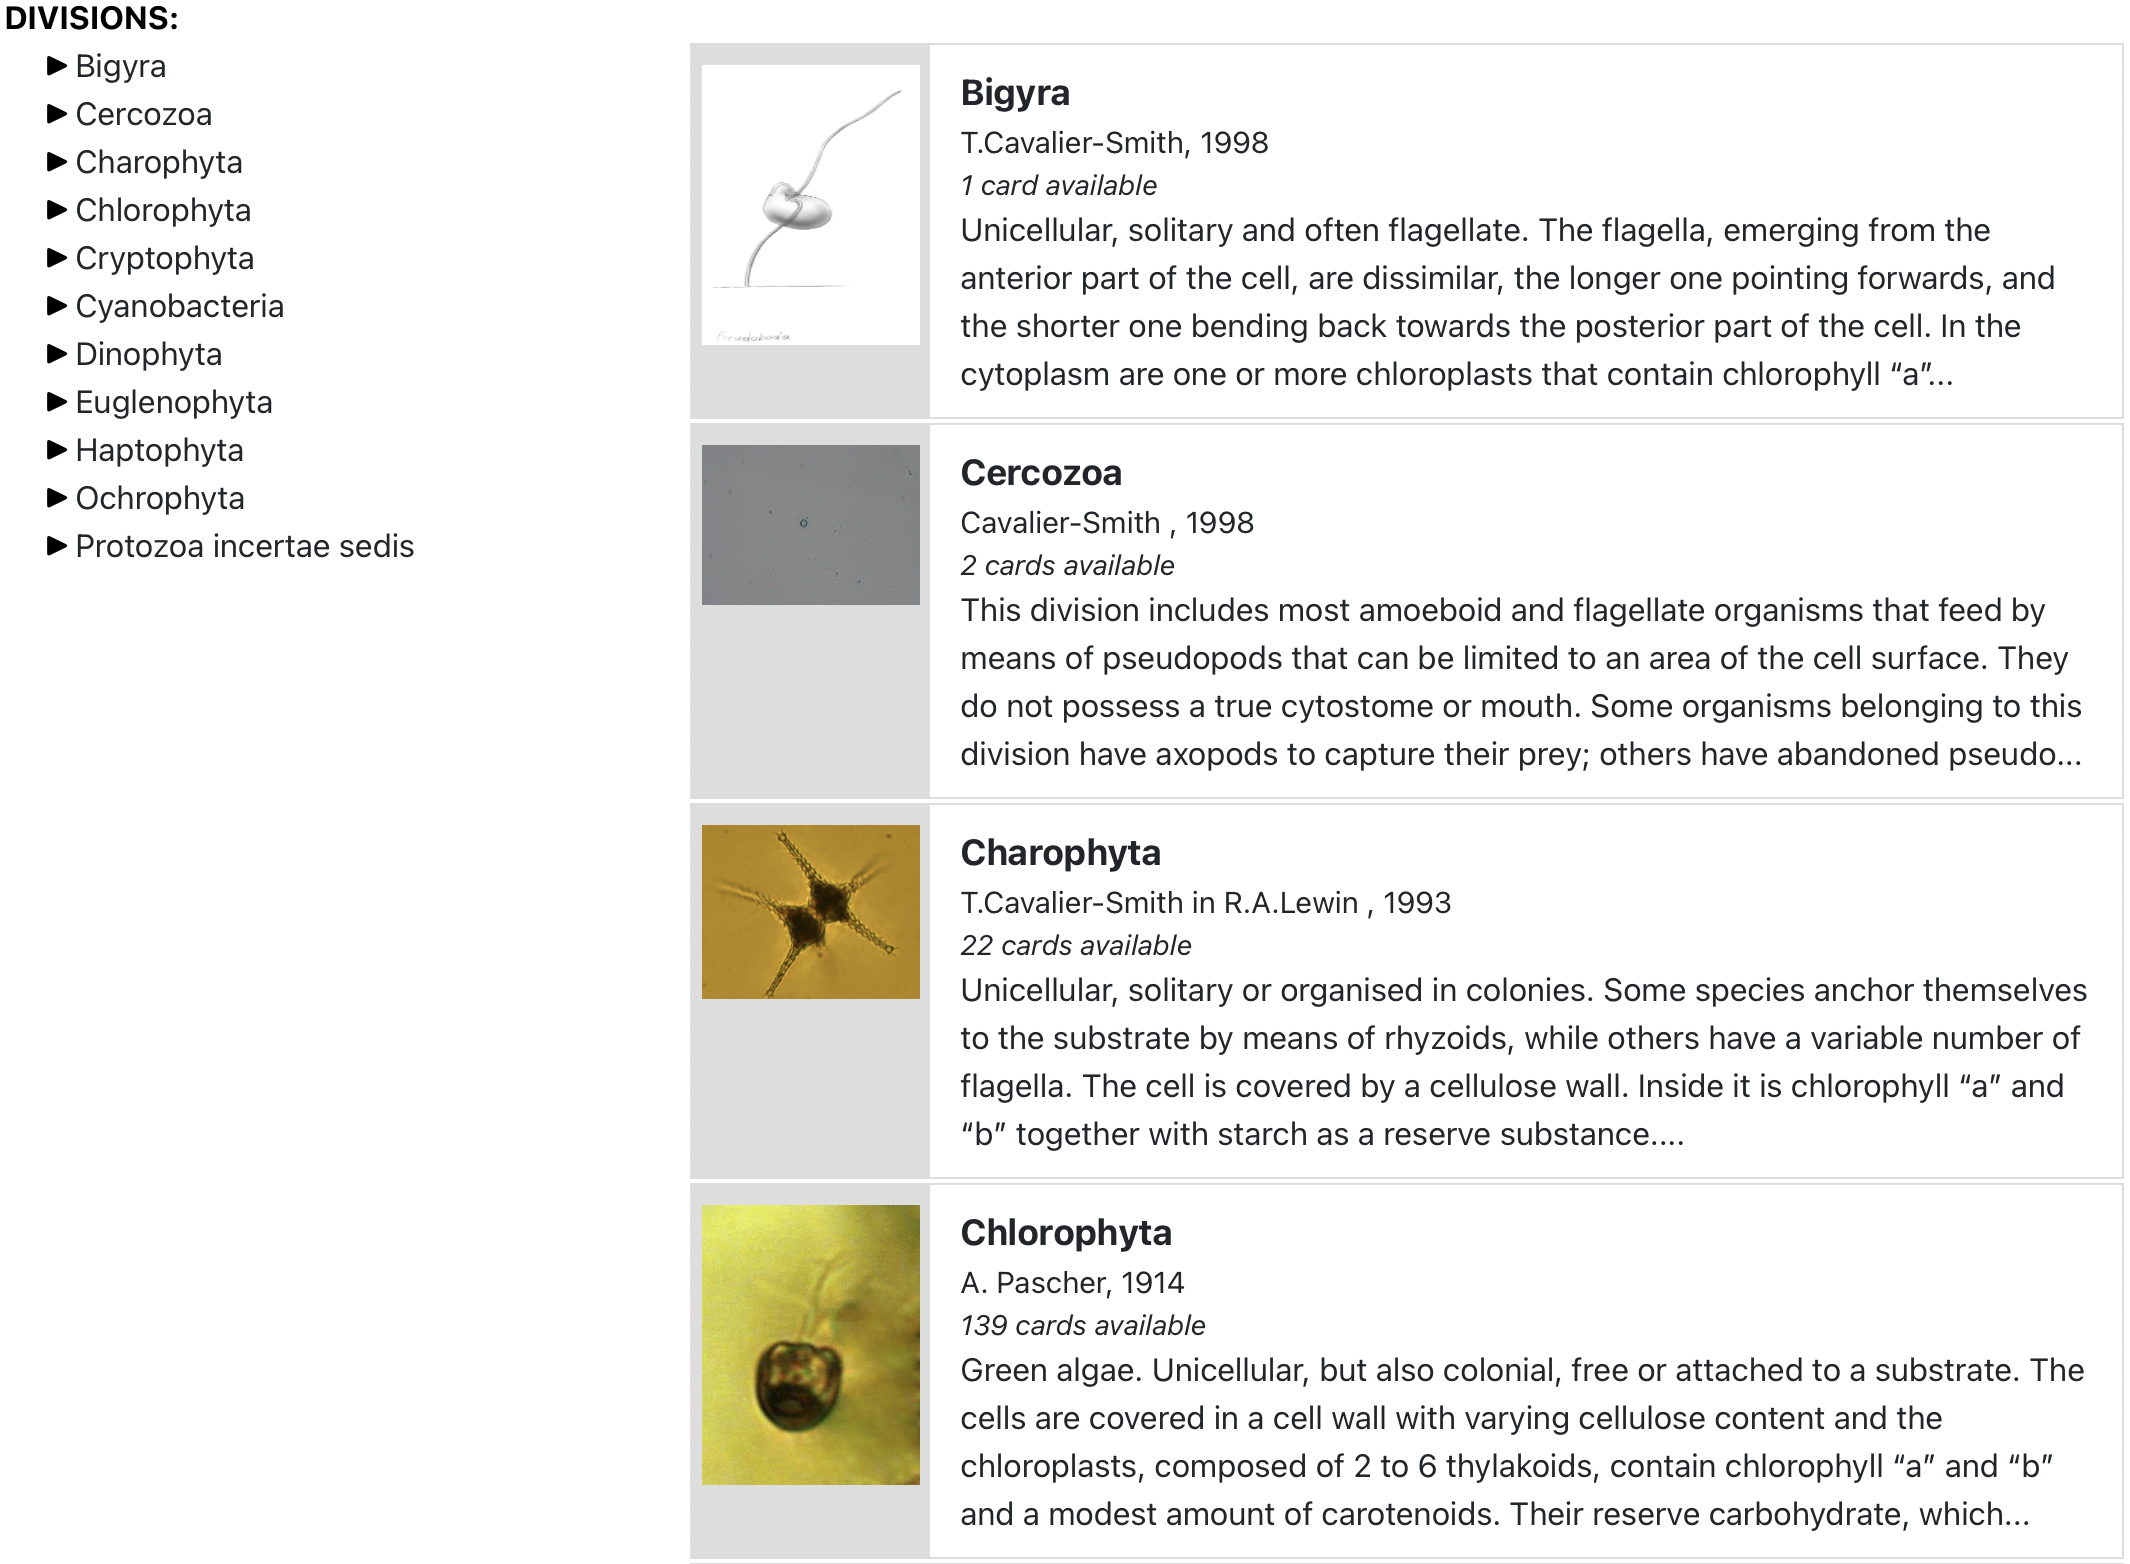
The Atlas of Phytoplankton is a reference point for marine, transitional and freshwater scientists and students involved in phytoplankton identification and classification, as it provides a list of all the phytoplankton species currently known, classified by division, class and genus.
The Atlas includes a total of 1,254 different species and, for each one of them, it provides an illustrative card that details:
- Taxonomy, with pictures and schematic drawings
- Information on similar species and/or synonyms
- Morphological characteristics and data
- Shape association, linear dimensions association and formulae for cell volume and surface computation
- Geographical distribution
- Notes on toxicity and resistance stages
- Bibliographic references
Click here to see an example of a phytoplankton species card
-
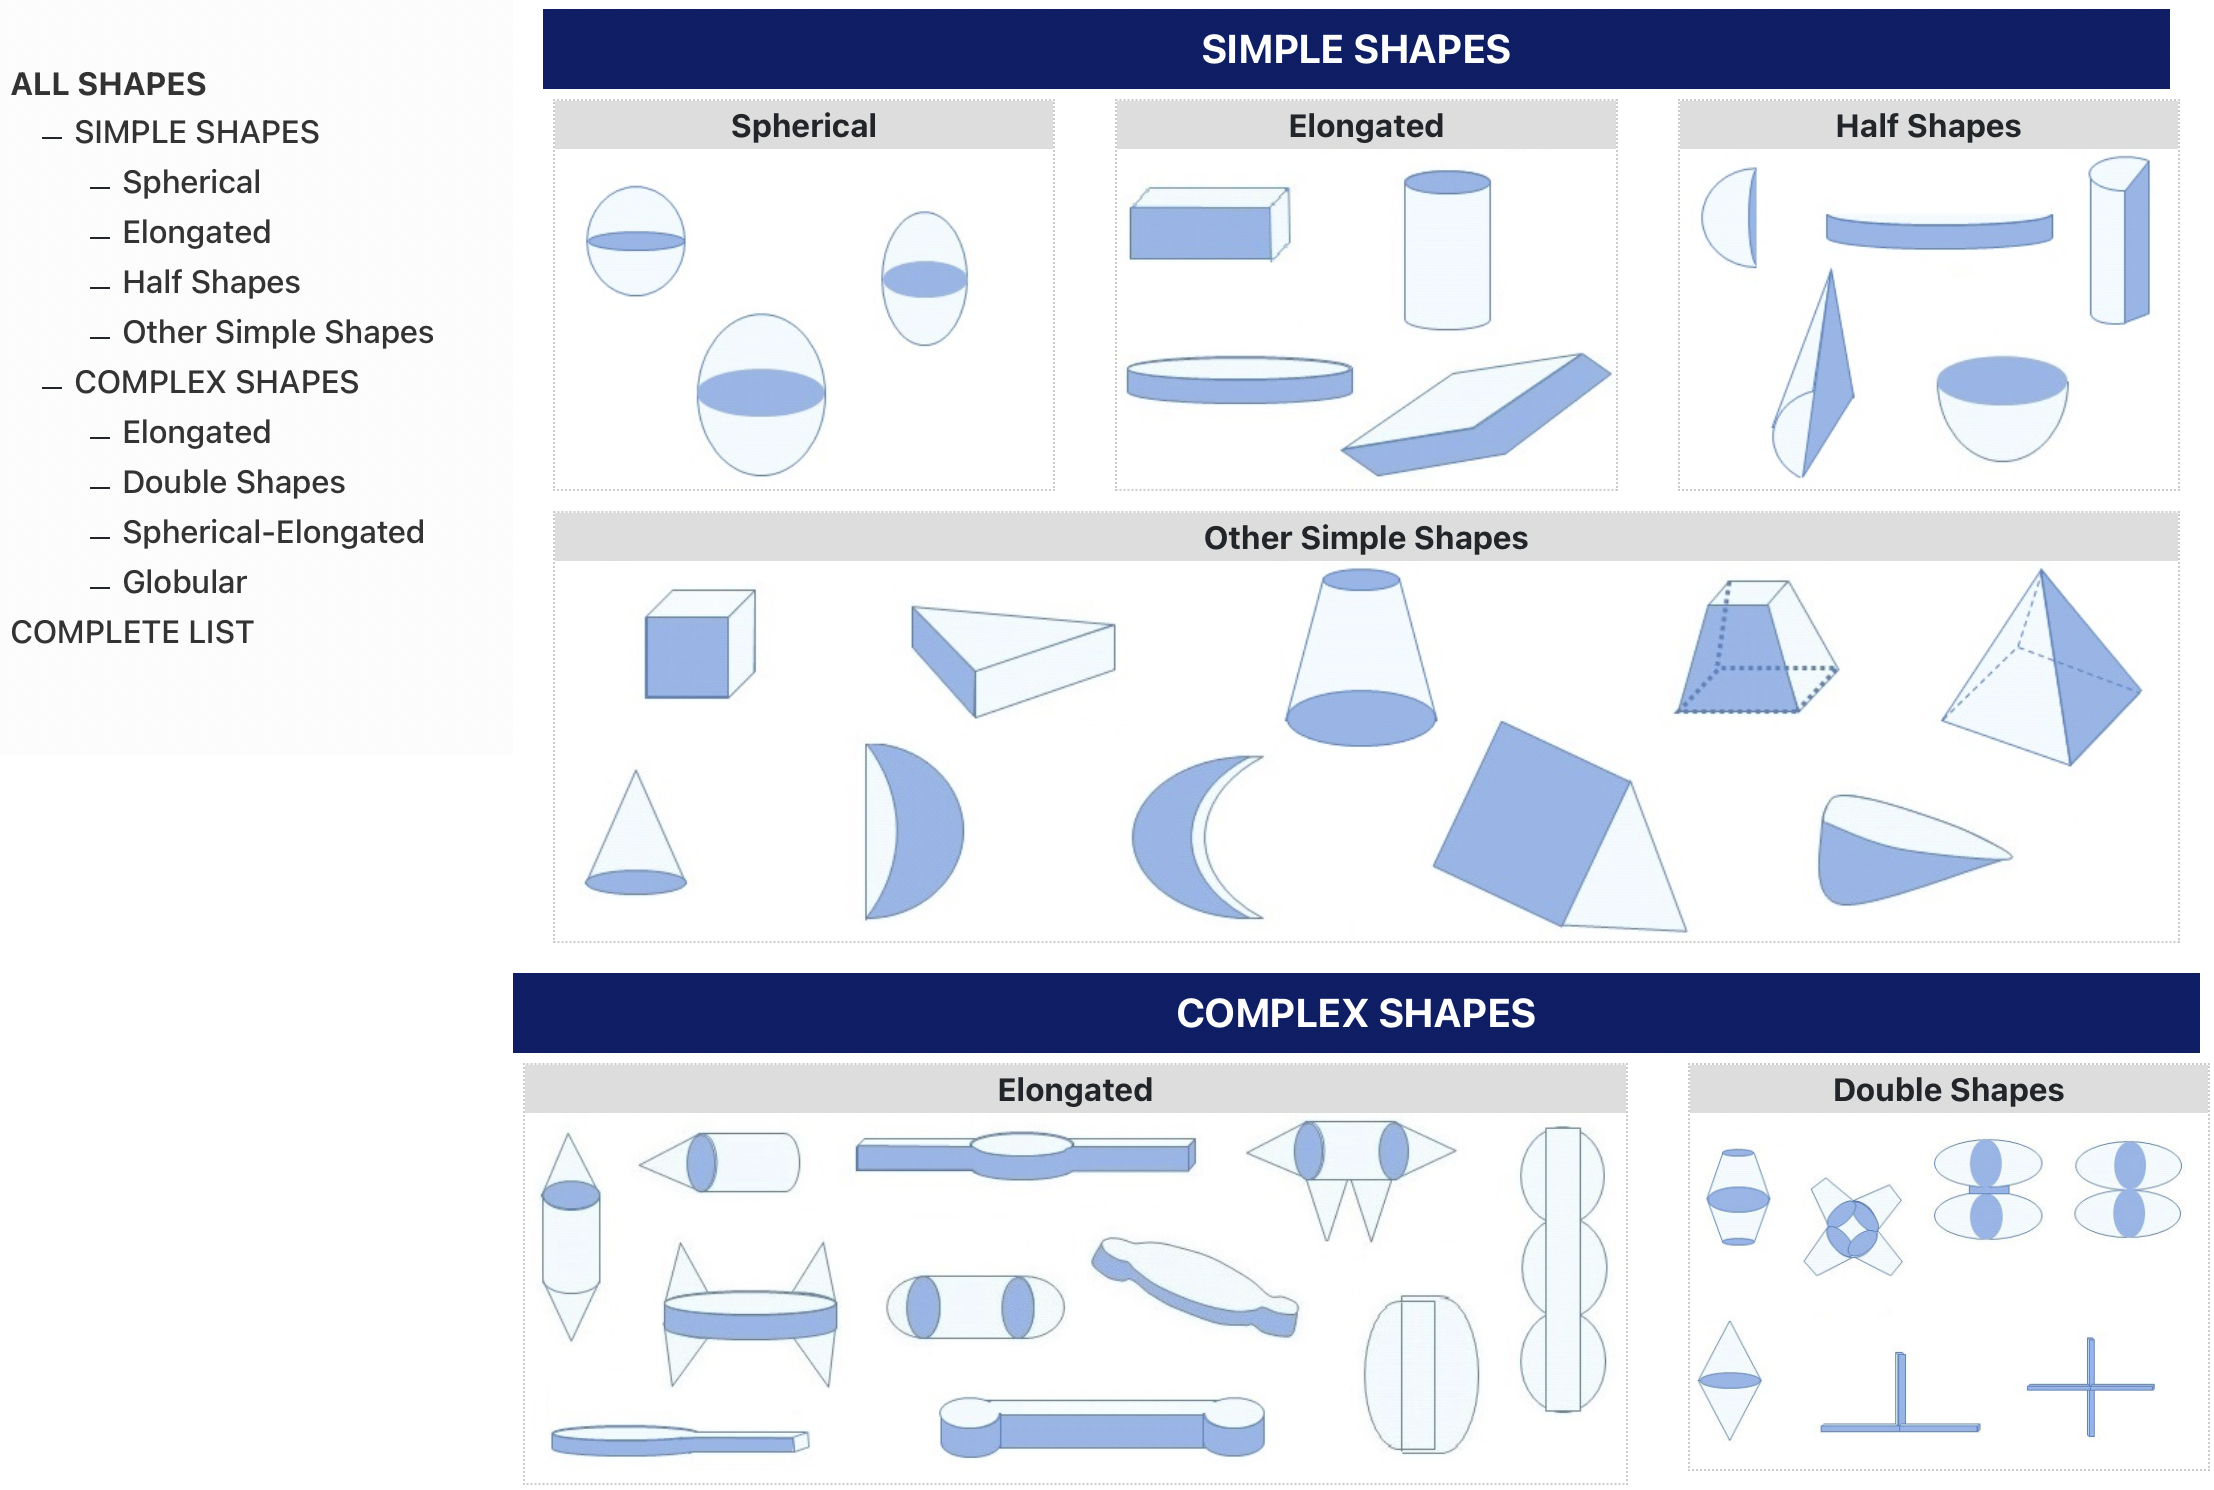
The Atlas of Shapes represents a reference point for marine, transitional and freshwater scientists and students involved in phytoplankton morphological traits association and measurement. It provides a schematic protocol for calculating biovolume of phytoplankton species detectable with the Utermöhl method in transitional ecosystems of the different world ecoregions.
The Atlas includes a total of 51 different shapes - with the illustrative scheme of the shape classification subdivided in “Simple Shapes” and “Complex Shapes” - and, for each one of them, it provides an illustrative card that details:
- Names
- Shape views (e.g., lateral, frontal, etc.) with the corresponding linear dimensions
- Biovolume and surface area computational models
- List of all species presenting a specific shape (clicking on the shape representation)
Click here to see an example of a phytoplankton shape card
Click here to browse the Atlas of Species
-
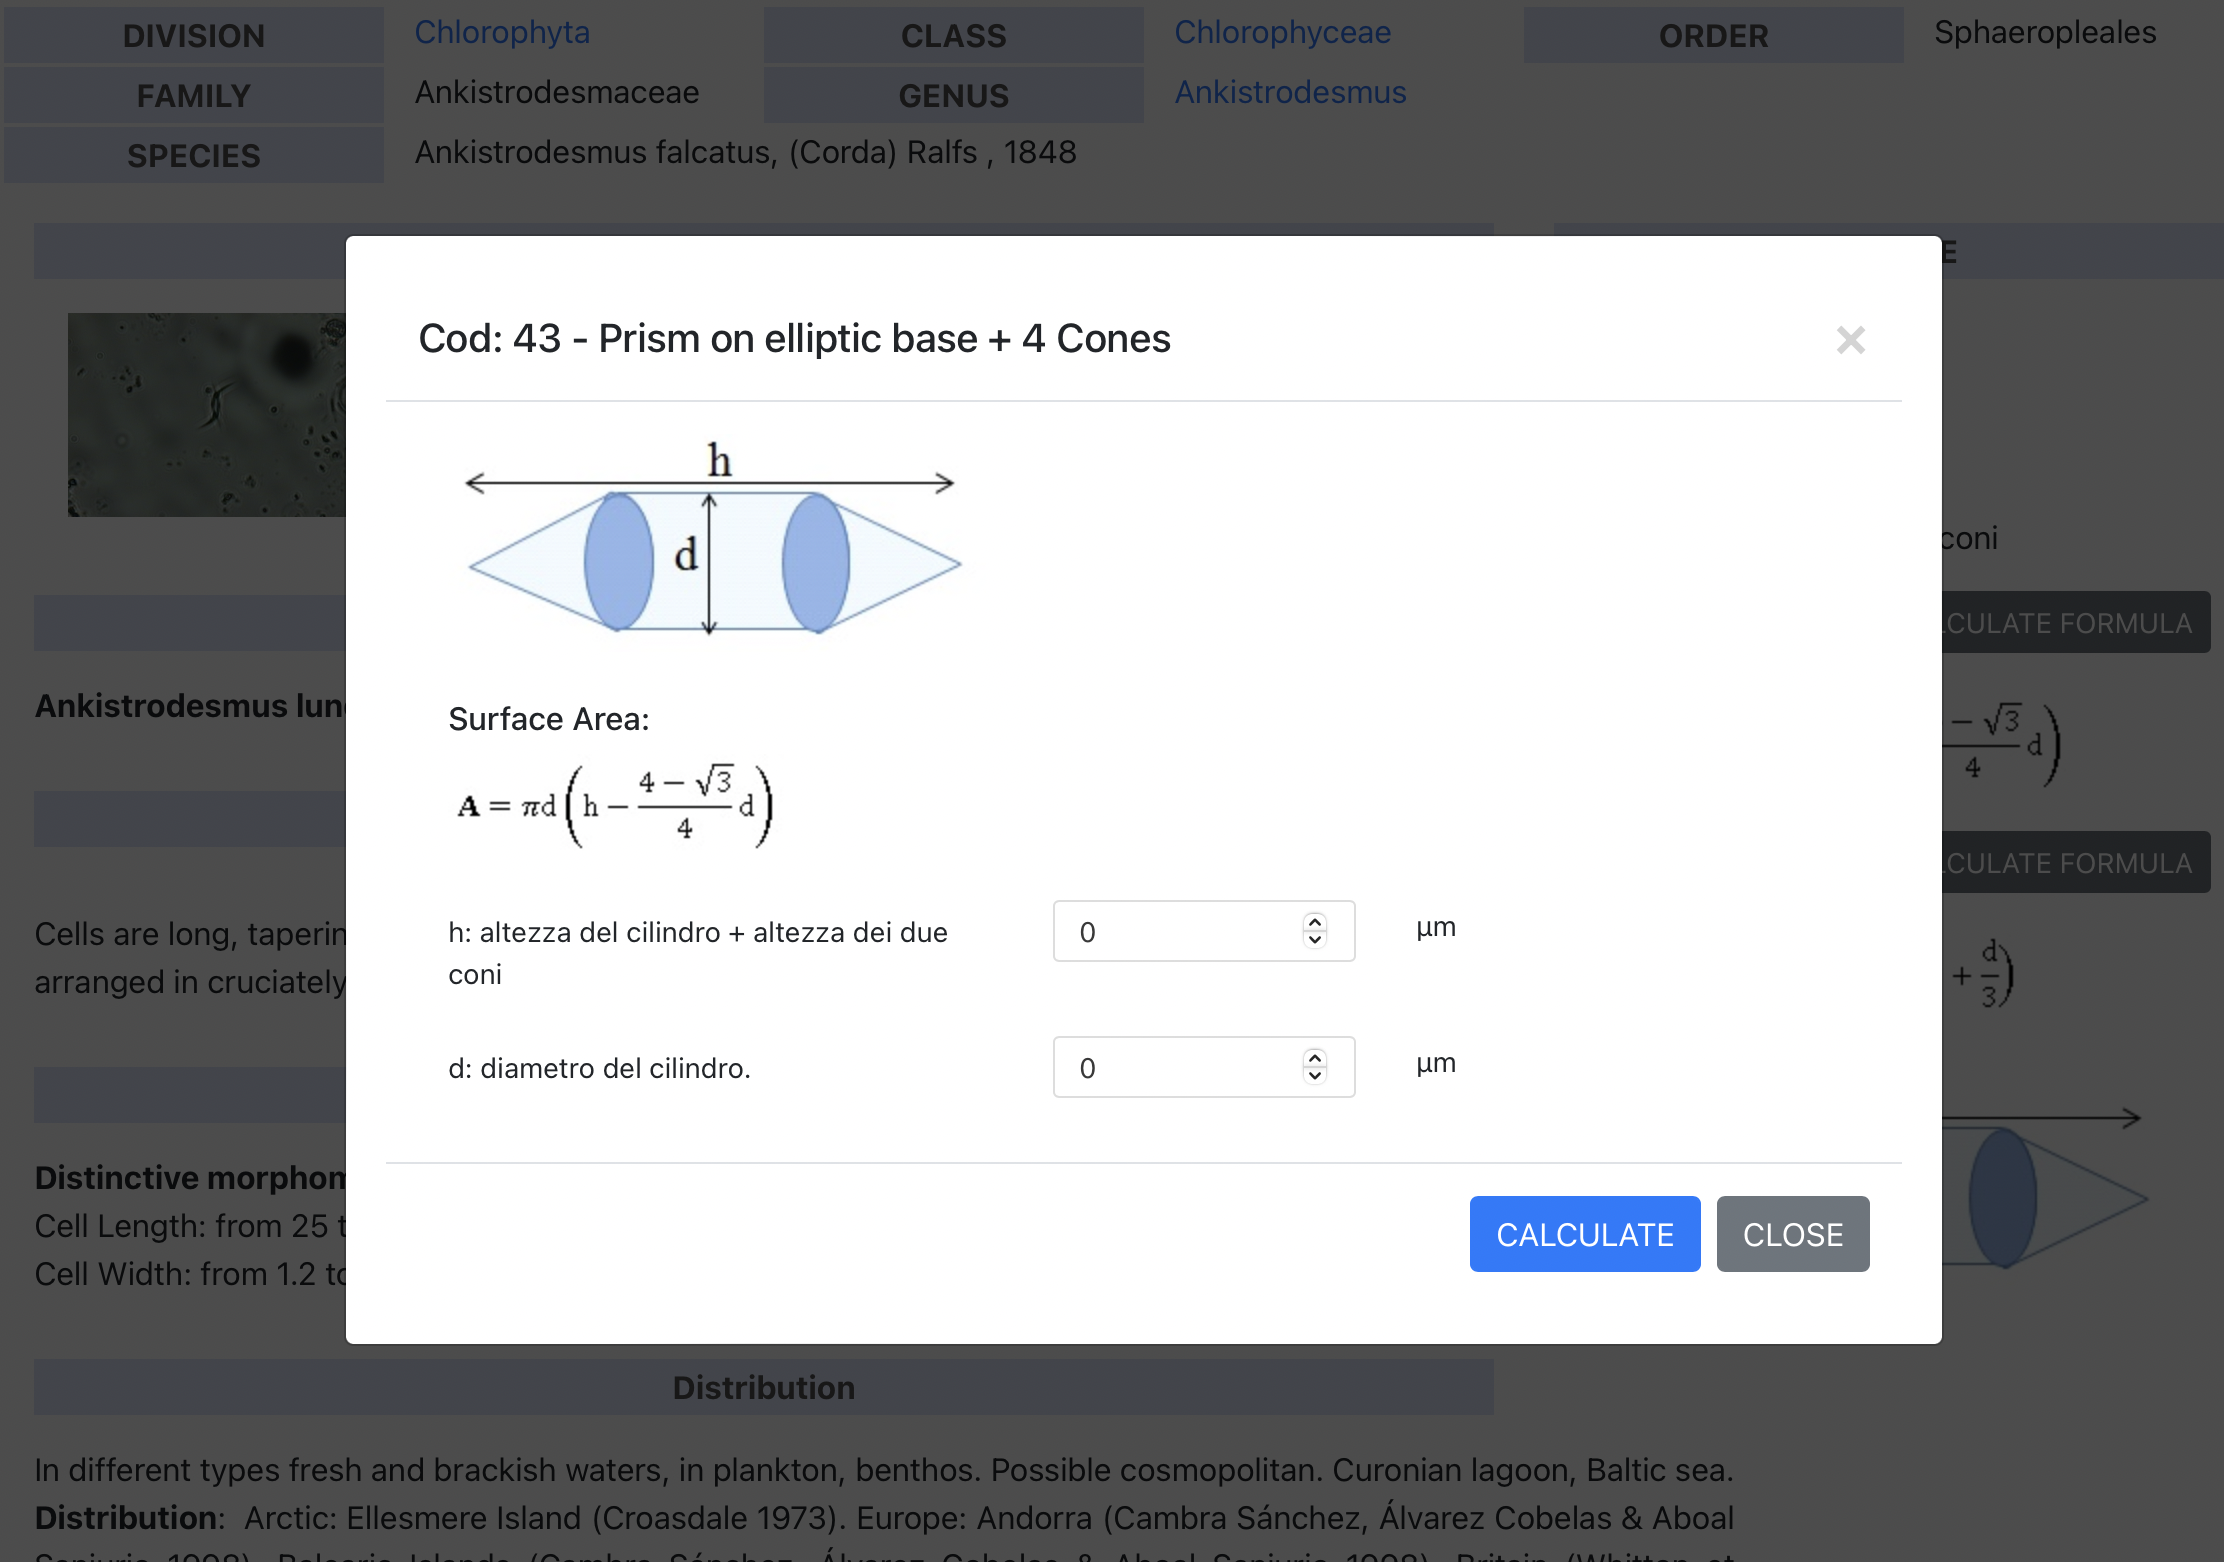
The Atlas of Phytoplankton provides an additional service that allows to directly calculate Surface Area and Volume of the phytoplankton species.
To do so, once the illustrative card of the selected species is reached, simply click on the "Calculate Formula" button.
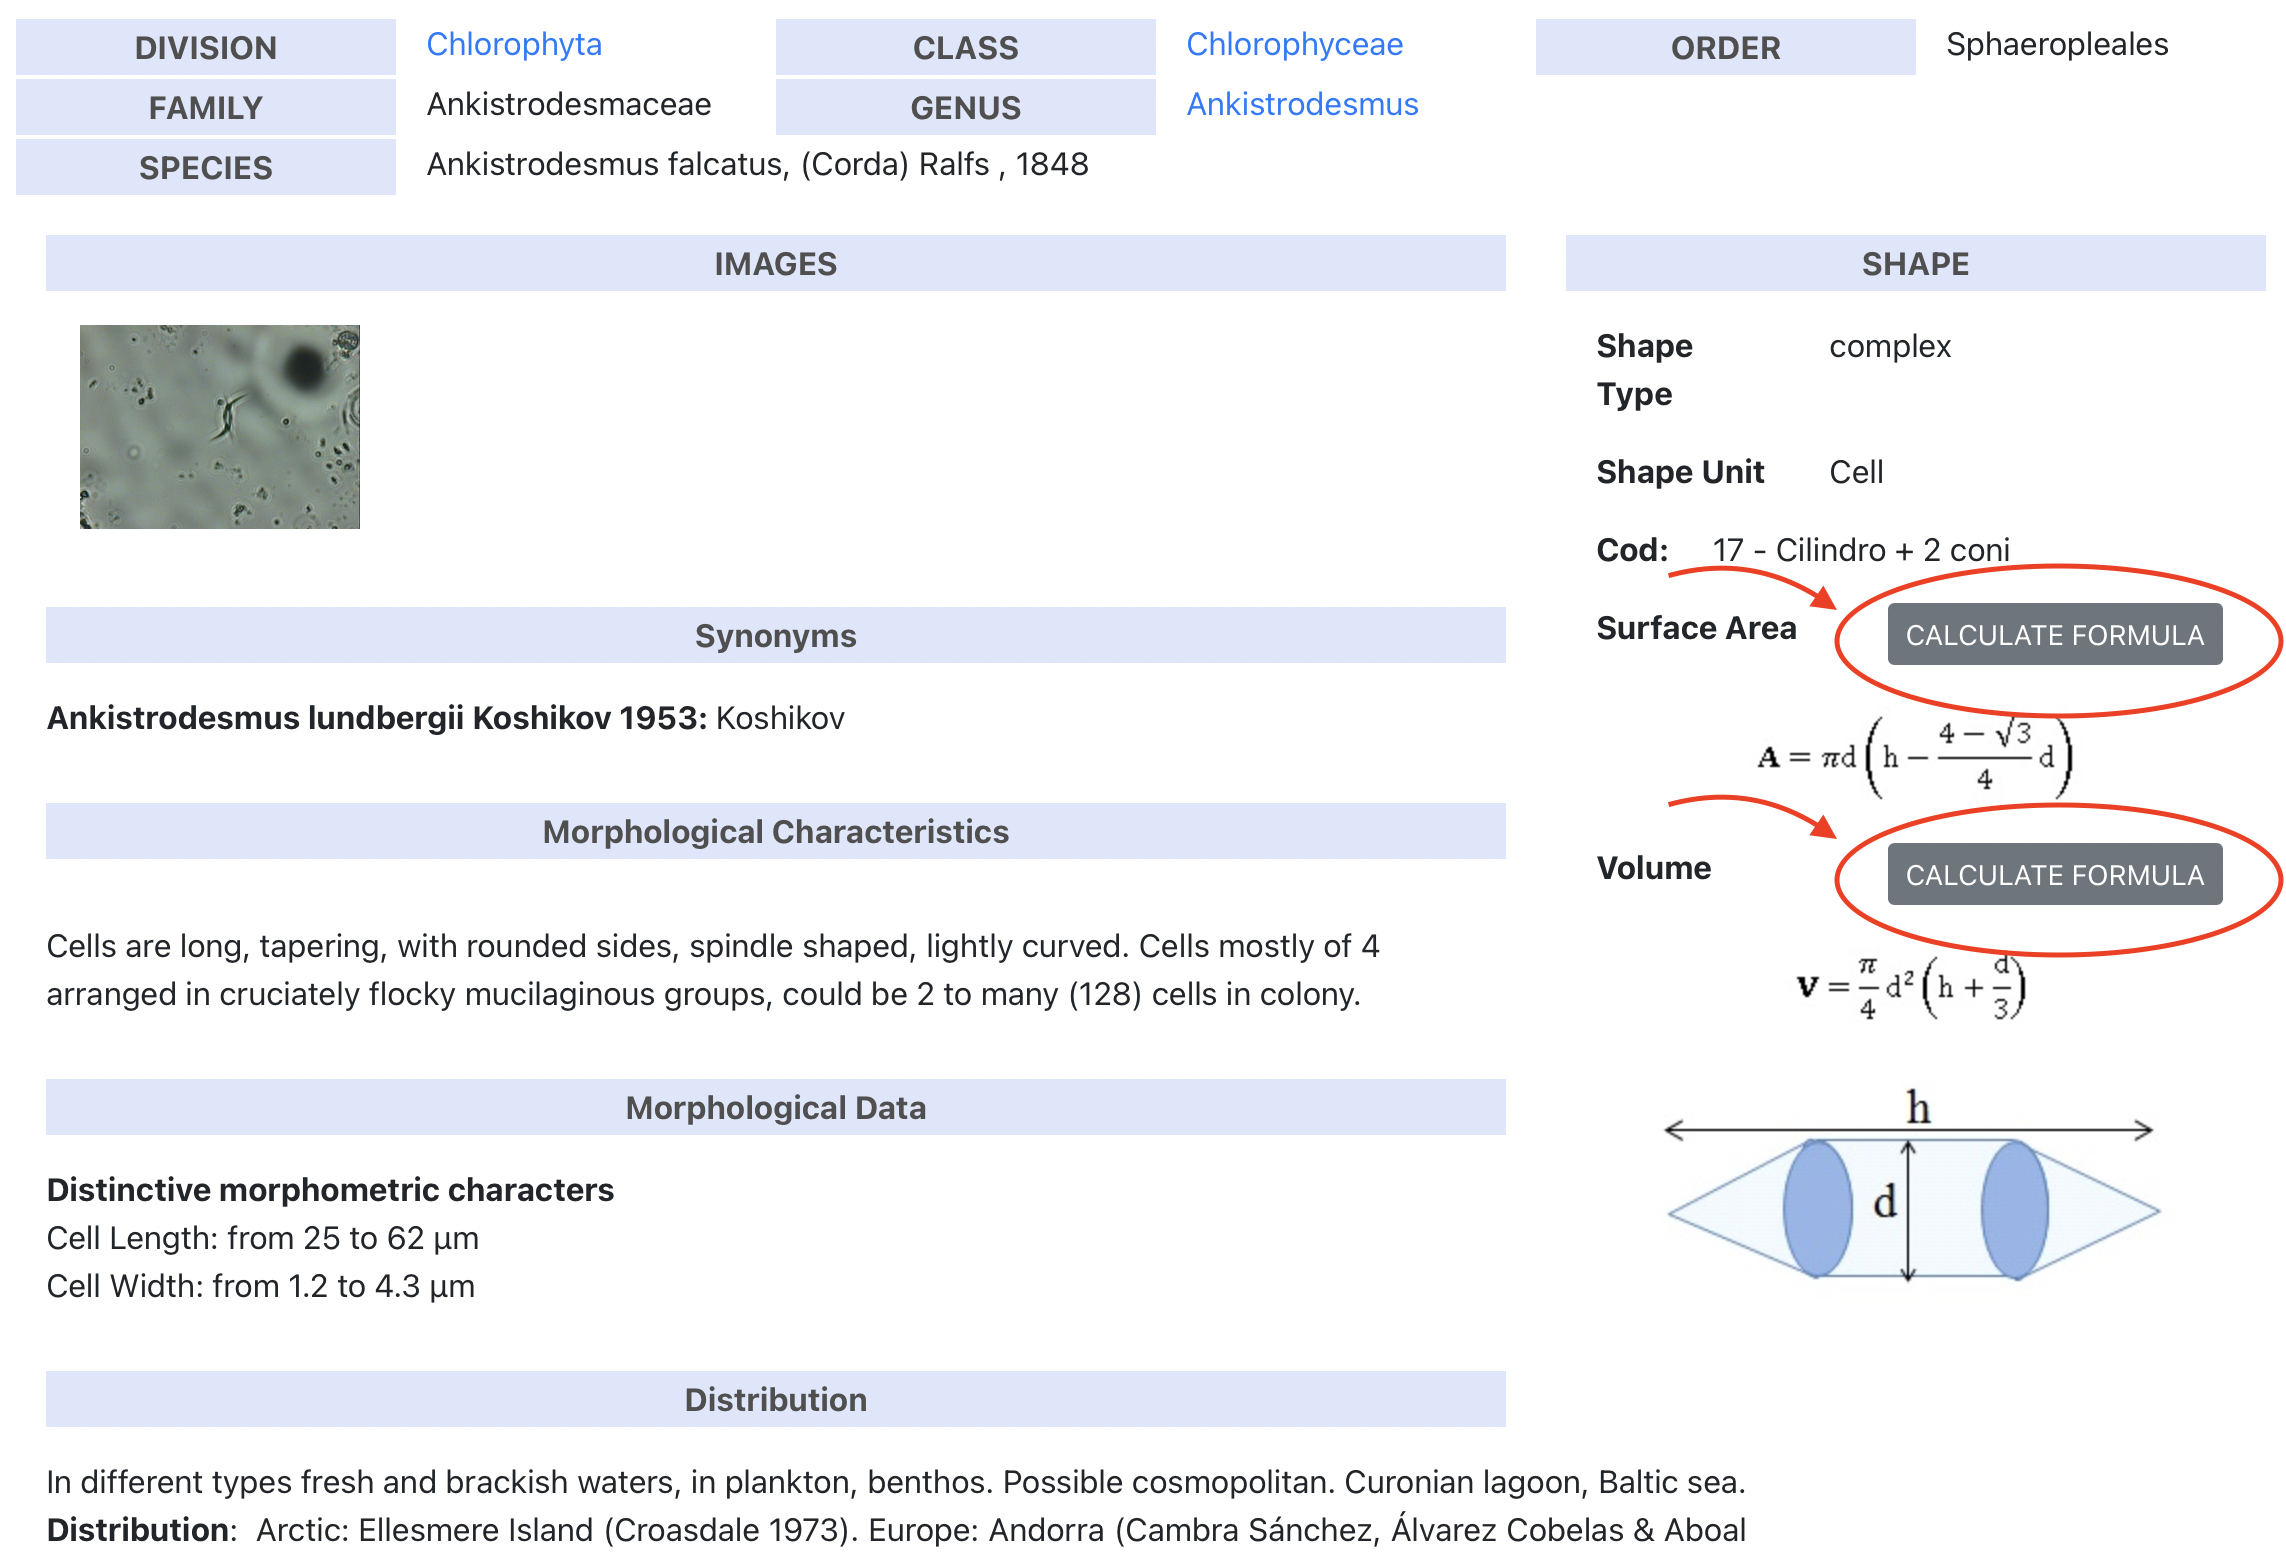
Once the pop-up window with the formula opens, simply input the relevant measurements (length, width, thickness, diameter, height, etc.) in µm and click "Calculate".
-
The LifeWatch Italy Phytoplankton Virtual Research Environment (Phyto VRE) enables researchers to:
- Access harmonised data on taxonomy and morphological traits by using the Atlas of Phytoplankton, Atlas of Shapes and Phytoplankton Traits Thesaurus;
- Access, download, and select LifeWatch Italy datasets (published through the LifeWatch Italy Data Portal and distributed by the LifeWatch ERIC Metadata Catalogue) or upload their own datasets structured according to the Phyto template based on the LifeWatch Italy Data Schema in order to execute the services included in the VRE;
- Facilitate the computation of morphological and demographic traits (such as hidden dimension, biovolume, surface area, surface-volume ratio, cell carbon content, etc.) and investigate their distribution patterns at different levels of data aggregation (i.e. spatial, temporal, taxonomic) by means of services which automate a set of operations written in the R language.
Besides the Atlas of Phytoplankton and the Atlas of Shapes, the other services provided by the Phyto VRE are:
-
Phytoplankton Traits Thesaurus
The first initiative to deal with the semantics of phytoplankton functional traits focusing on morpho-functional traits. PhytoTraits reflects the agreement of a scientific expert community to fix semantic properties (e.g. label, definition) of approximately 120 traits. -
Traits Computation
This workflow calculates Phytoplankton Traits (Biovolume, Surface Area, Surface Volume Ratio, Cells/Liter, Biovolume/Liter/Carbon Content and Carbon Content/Liter) and Selection (for each selected location/groups of locations, the script allows to exclude from the dataset rare taxa based on their rank distribution in density (n of cells per liter), biovolume per liter (μm3 of cells per liter) or carbon content per liter (pgC per liter)). -
Data Filtering
For each selected location/groups of locations, this calculation allows to exclude from the dataset rare taxa based on their rank distribution in density (n of cells per liter), biovolume per liter (μm3 of cells per liter) or carbon content per liter (pgC per liter). -
Size Class Distribution
For any given sampling site and/or sampling time, the script calculates individual abundance of logarithmic size classes the biovolume or biomass distributions. -
Size Density Relationships
This service calculates cross community, global or local size ~ density scaling relationships for any given combination of sites, sampling times and taxonomic level of observations. Both average trend power law and upper quantile boundary regression (quantile 0.95) are computed. -
Community Matrix & Analysis
The workflow converts the LifeWatch dataframe format into a community matrix (site*taxa) for each selected location/groups of locations, finally processes community matrices. Typologies of community composition analysis that can be performed are species rarefaction curve; nonmetric multidimensional scaling (NMDS); cluster analysis; beta diversity; and distance matrix. -
Community Indexes
For any given sampling site and/or sampling time, the workflow also computes several community indices and/or individual size spectra statistics (biovolume in μm3 or biomass in pgC) from an individual or aggregated LifeWatch dataset.