AGROECOLVRE - Soil and subsoil carbon sequestration metadata analysis as a function of land uses and agroecological practices
Course: AGROECOLVRE - Soil and subsoil carbon sequestration metadata analysis as a function of land uses and agroecological practices | LifeWatch ERIC Training Platform
-
Context & scientific questions
Context
Soil carbon sequestration is key to mitigating climate change and improving agroecosystem productivity, with soils storing 85% of terrestrial carbon. However, data fragmentation hampers understanding of soil organic matter and its link to land use and management practices. To address this, AGROECOLVRE, funded under AgroServ's 1st Transnational/Virtual access call for research projects, will use a multi-dimensional approach. It will start with a stakeholder mapping and assessment of existing databases. A Qualitative Stakeholder Panel will capture user needs to customize a Soil Health module in the LifeWatch ERIC Virtual Research Environment (VRE) for Agroecology. Interdisciplinary collaboration will ensure the integration of specialized tools, providing researchers and policymakers with a standardized database and analytical platform to model, monitor, and enhance soil carbon sequestration. A case study will analyze the carbon storage potential as a result of the soil pH gradient and type of land use.
Scientific questions
Through the development of this workflow we aim at addressing the main scientific questions as follows:
Q1: Can we use LUCAS data (Topsoil and Core datasets) to assess the long-term impact of land use on the soils chemical variables at different scales (regional to EU)?
Q2: Can we assess the carbon sequestration potential of soils in relation to a soil pH gradient and different land use types across EU?
-
Before running the workflow
Due to data access restrictions imposed by the Joint Research Centre (JRC), the original LUCAS datasets cannot be redistributed through the platform. Users are required to obtain the original datasets from official sources or utilize the anonymized/simulated datasets available in the LifeWatch ERIC Metadata Catalogue (https://metadatacatalogue.lifewatch.eu/srv/eng/catalog.search#/metadata/b2417c13-e506-43b4-b437-7f4de3287b43) and already selectable within the VRE. These datasets have been generated in compliance with FAIR principles to ensure reproducibility while respecting data governance constraints. In addition, the tool has been designed to be flexible and reusable with datasets beyond LUCAS, enabling its application in different geographical and research contexts.
The VRE integrates publicly available EU-wide LUCAS datasets provided by the European Commission through Eurostat and the Joint Research Centre. Users are required to obtain the original datasets directly from the official sources:
A. LUCAS Topsoil datasets
- LUCAS Topsoil 2009/2012 – Available upon request: https://esdac.jrc.ec.europa.eu/content/lucas-2009-topsoil-data
- LUCAS Topsoil 2018 – Available upon request: https://esdac.jrc.ec.europa.eu/content/lucas-2018-topsoil-data
B. LUCAS Core datasets
- LUCAS Core 2009 – Direct download: https://ec.europa.eu/eurostat/documents/205002/208938/EU_2009_20200213.CSV
- LUCAS Core 2018 – Direct download: https://ec.europa.eu/eurostat/cache/lucas/EU_2018_20200213.CSV
The analytical workflow and source code are openly available through a public GitHub repository (https://github.com/xavi-rp/agrecolvre).
-
Workflow architecture
The process is organized across four sequential phases: it starts with Step 1, dedicated to the import and preliminary cleaning of the datasets (LUCAS-Core 2009 and LUCAS-Topsoil 2018), before moving on to the exploration, filtering, and selection phase of the sampling points and variables of interest (Step 2a and Step 2b), with the simultaneous generation of summary tables. Finally, the data are subjected to two different advanced statistical analysis approaches, Principal Component Analysis (Step 3, PCA) and Analysis of Variance (Step 4, ANOVA), both designed to produce analytical outputs in both tabular (.csv) and graphical (.png) formats (Fig. 1).
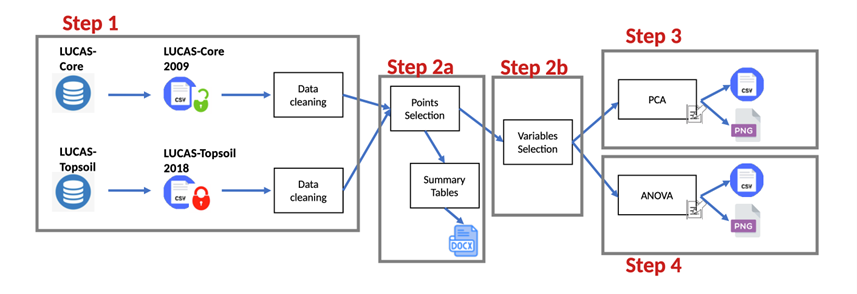
Fig. 1. Illustrative workflow diagram
STEP 1. Reading in LUCAS data
This initial service reads the core and topsoil datasets for 2009 and 2018 performing also a data cleaning and standardisations. If personal raw LUCAS-Topsoil datasets are used, they can’t be distributed with any 3rd party, and under any circumstance, outside the VRE due to data governance constraints.
STEP 2a. LUCAS data selection and exploration
This step allow users to filter and explore the synchronized datasets, selecting LUCAS-Soil 2018 points that share the exact same Land Use (LU) as in 2009. It aggregates points by region, counting the total sampled rows for both Topsoil and Core datasets. It counts unchanged points by region and Land Cover (LC) class (Broadleaf, Coniferous, Shrubland, and mixed Forest+Shrubland).
Output Generated:
A comprehensive document containing a summary table with 8 specific columns tracking the point counts per region, designed to easily fit a standard page with a caption (summary_table1.docx).
STEP 2b. LUCAS data selection (Area of Study)
In this step, the user defines the geographical boundaries and relevant variables for the analysis for both PCA and ANOVA.
Parameters: The user can provide a specific region study argument (as a vector supporting NUTS0, NUTS1, NUTS2, or NUTS3). If left blank, the system applies ‘ES11’ (Galicia, Spain) as the default baseline region.
Filtering: The workflow restricts rows exclusively to forests, shrublands, and grasslands, isolating the specific land covers relevant to the agroecological study.
STEP 3. Principal Component Analysis (PCA)
Executes a PCA on the eight primary LUCAS soil chemical variables to reduce dimensionality and extract patterns.
Missing Data Management: To handle missing values (NAs), rows containing any incomplete data are excluded from the computation for simplicity and transparency.
Outputs Generated:
- A PCA chart plotting PC1 against PC2 (pca_plot.png).
- A visual chart plotting PC1 against PC2 considering Land Cover class (pca_plot_byLC.png).
- An Excel spreadsheet summarizing the statistical results and eigenvalues of the PCA (pca_summary.xlsx)
- An Excel spreadsheet summarizing the statistical results and eigenvalues of the PCA considering Land Cover class (pca_summary_byLC.xlsx)
STEP 4. ANOVA (Analysis of Variance)
To evaluate whether the 8 soil chemical characteristics differ significantly among distinct ecosystem categories, a one-way ANOVA is conducted across the Land Cover groups. Post-hoc Tukey tests are implemented to identify specific group variances.
Outputs Generated:
- Exploratory boxplots for each land cover grouped by soil parameter(bxplt_variable_LC.png).
- Frequency distribution histograms for each category (histograms_variable_LC.png).
- Graphical representation of ANOVA results combined with Tukey honest significant differences (anova_boxplots_tukey.png).
- A structured spreadsheet containing the complete ANOVA statistical summary tables (ANOVA_summary.xlsx).
-
Accessing the workflow
The Workflow is directly accessible on the web-portal of LifeWatch ERIC using the link https://my.lifewatch.dev/workflow/create-workflow-from-template/lucassoil. Several login options are available, including LWOS (LifeWatch), Google, or EGI / EOSC credentials (Fig. 2).
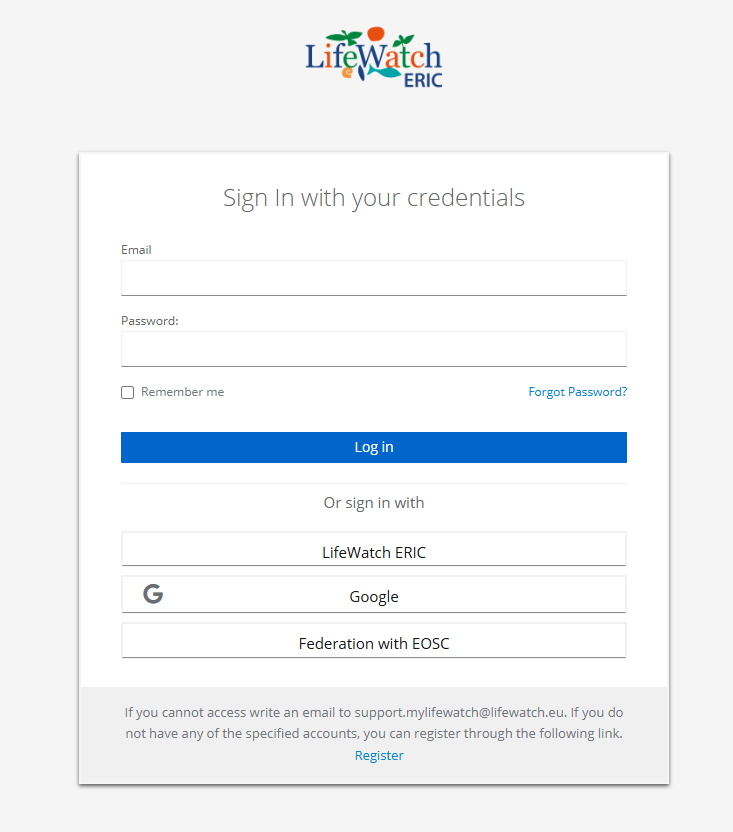
Fig. 2. Login interface. The user can access the workflow using LWOS (LifeWatch), Google, or EGI‑EOSC credentials.
If you are already navigating on the 'My LifeWatch ERIC' digital platform (https://my.lifewatch.eu), you can access the VRE by following this path (figure 3):

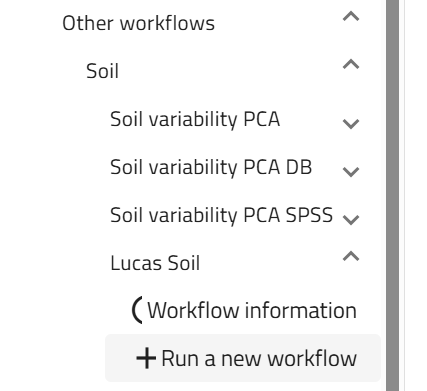
Fig. 3. Access path to the LUCAS Soil workflow versions, available on the left side panel in My LifeWatch ERIC.
-
1.-2. Workflow overview and description
Once you have chosen the Lucas Soil workflow, you will be redirected to the workflow overview, where you will find the workflow schematics (Fig. 4).
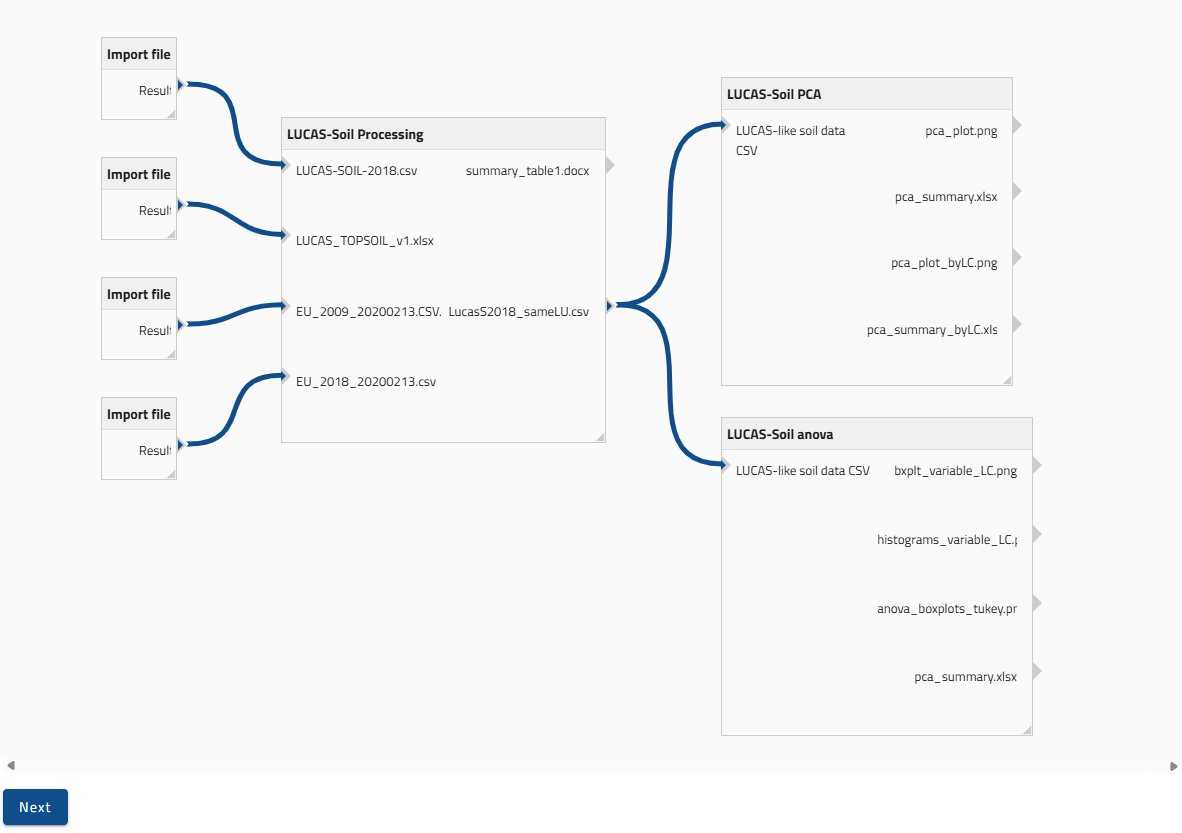
Fig. 4. Workflow overview.
To advance, please press ‘Next’.
Type a word or phrase that helps you remember and find back the workflow you are about to run then press ‘Next’. Your workflow will be stored under this name in your dashboard (Fig. 5).
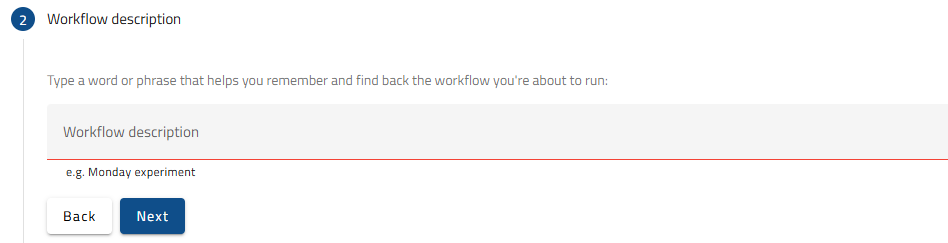
Fig. 5. Workflow description prompter.
IMPORTANT: You can return to completed or in-progress steps, identifiable by the number icon on the left changing from grey to blue, to make further changes or corrections (Fig. 6).
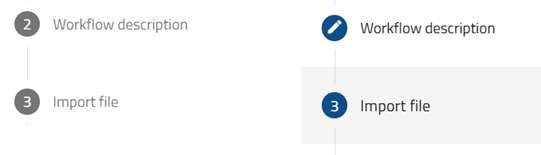
Fig. 6. Steps yet to be completed on the left (grey) and completed steps on the right (blue).
-
3. to 6.- Import File
In this phase, you will need to select the four files required to run the workflow. The system will display the VRE folders containing Public available Data by default on the left; as first locate and click on the 'Lucas_Soil' folder. The other available options, 'My private data' and 'My FAIR data', allow you to choose from your own databases uploaded to the My LifeWatch ERIC system. If they comply with the LUCAS syntax, you will be able to import and analyze them.
Find the file that matches the name shown in the 'Input Name' field at the center of the screen to upload the anonymized/simulated datasets.; the name will end with '_anonym'. The first file to locate is 'LUCAS-SOIL-2018', so you will need to find 'LUCAS-SOIL-2018_anonym.csv' in the scrollable list on the left and click it (Fig. 7).
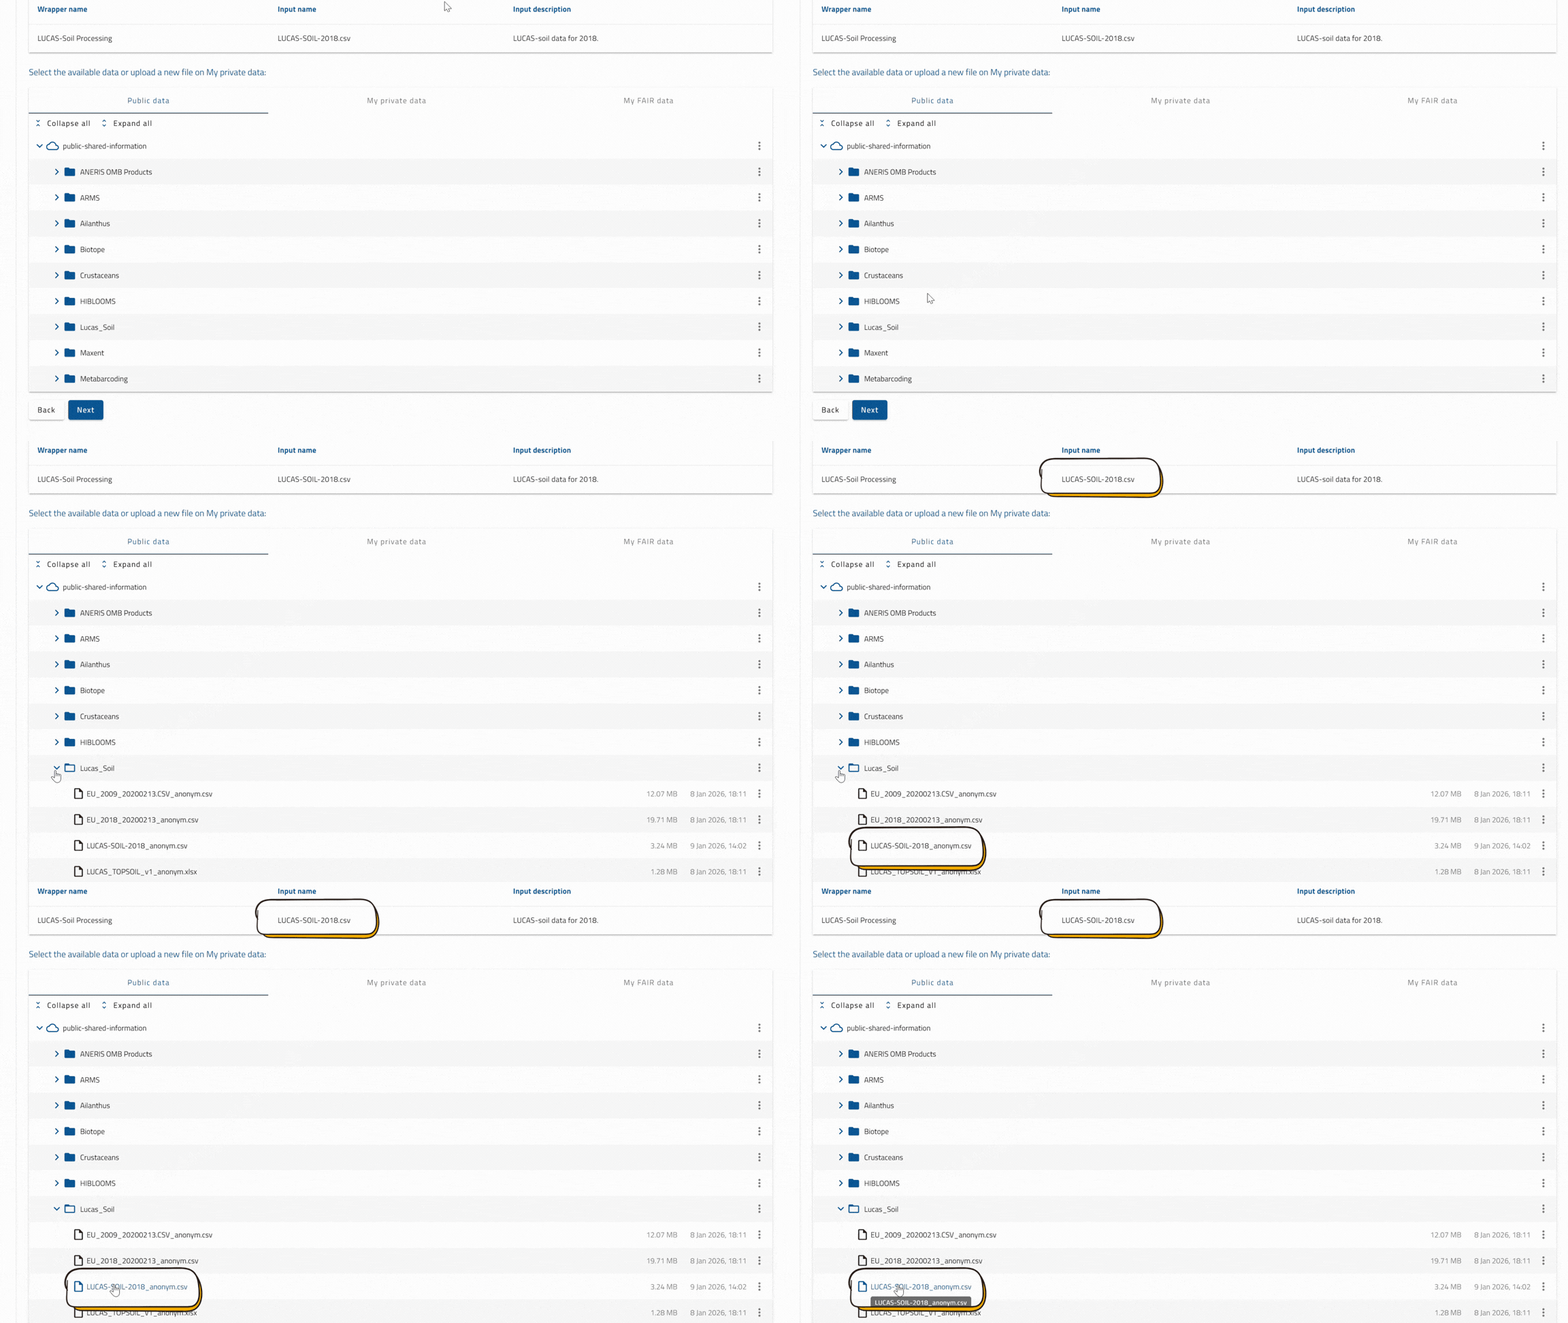
Fig. 7. Select a file to load into the VRE
NOTE: Please remember that files labelled with 'anonym' contain LUCAS anonymized/simulated datasets already uploaded in the VRE.
If you want to verify that the import files have been uploaded, you can go back to the specific upload step. If it has been uploaded successfully, the file will be highlighted in green, and its path within the VRE will appear at the bottom of the box (Fig. 8).
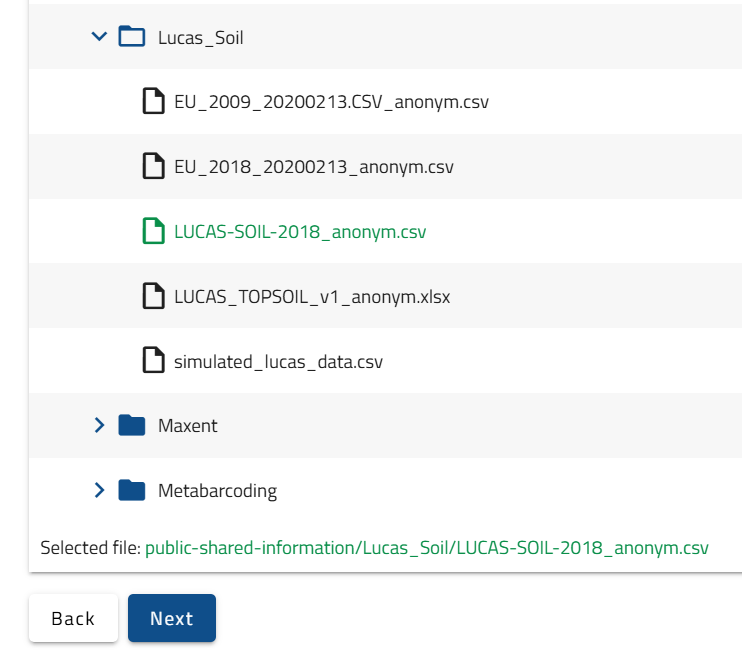
Fig. 8. File import verification.
IMPORTANT: Repeat this process in the next three ‘Import file’ steps to import the required files for the workflow selecting in order:
• 'LUCAS_TOPSOIL_v1 anonym.xlsx' in step 4;
• 'EU_2009_20200213.CSV_anonym.csv' in step 5;
• 'EU_2018_20200213_anonym.csv' in step 6. -
7.- LUCAS-Soil Processing
Now that you have reached the LUCAS-Soil Processing service, which features the LUCAS data and geographical data selection and exploration, you will see a pre-filled field containing the comma-separated entries 'PT16,ES11,ES30,FRD,NL,FI,DE40,SK,EL,ITI1'. When using simulated data, specify the list of regions to include for LUCAS point comparison, entering them as comma-separated values exactly in your preferred NUTS0/1/2/3 order. If you are working with personal data, select your specific regions of interest (Fig. 9). Then, click 'Next' to proceed.
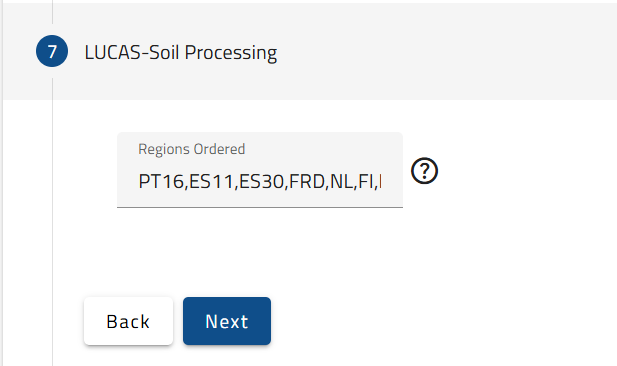
Fig 9. Selection of the study regions.
IMPORTANT: To avoid workflow errors, do not leave empty spaces between letters when selecting regions and variables.
In the example shown, the user has selected NUTS0 and NUTS1 as the regions to be included in the comparison (Fig.10).
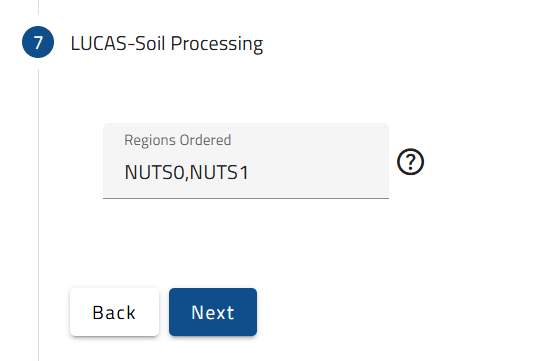
Fig.10. Example of study region selection.
-
8.- LUCAS-Soil PCA
In this step, select the study regions and environmental variables relevant to your research to run PCA. The system defaults to region ES11 and 8 variables (pH_CaCl2, pH_H2O, EC, OC, CaCO3, P, N, and K). Make sure to enter the same regions specified in step 7. Then, click 'Next' (Fig. 11).
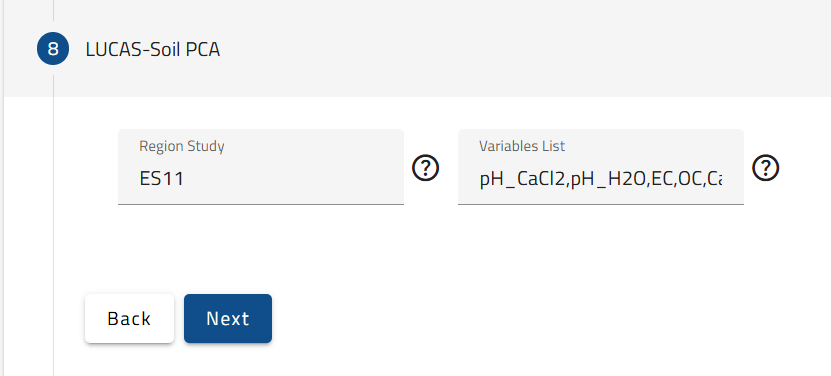
Fig 11. Selection of the study regions and visualization of the variables to consider in the PCA.
-
9.- LUCAS-Soil anova
In this step, select the regions and variables required to run a one-way ANOVA. Again, the system defaults to region ES11 and 8 variables (pH_CaCl2, pH_H2O, EC, OC, CaCO3, P, N, and K). Select the same regions you indicated in step 7, then click 'Next’ (Fig. 12).
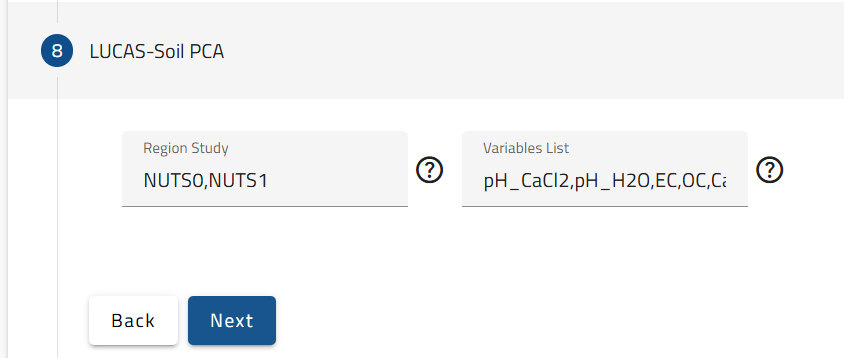
Fig. 12. Selection of the study regions and visualization of the variables to consider in the ANOVA.
-
10. Save and launch the workflow
With the previous steps successfully completed, you can now save your workflow to the platform and run it (Fig. 13).
Fig. 13. Button to save and launch the workflow.
Once the workflow is successfully created, two buttons will allow you to navigate either to your personal ‘Workflow List’, where you can visualise all your workflow list saved in the dashboard of My LifeWatch ERIC, or directly to the ‘Workflow Insight’ section (Fig. 14).
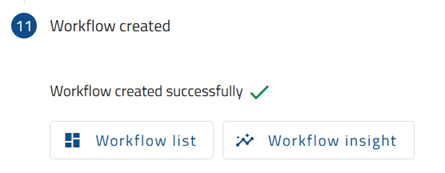
Fig. 14. Workflow control buttons.
-
11. Check the results
On the action column on the right area of the desk, you can select the workflow of your interest, duplicate, see the detailed information, run it again or deleted.
If you press ‘Workflow list’, you will be redirected into your Dashboard (Fig. 15) where you can find all your workflows and their status. On the right area of the desk, the action column, you can choose in order among select the workflow of your interest, duplicate, see the detailed information which will route you to the workflow insight (Fig. 16), run it again the workflow or deleted it.

Fig. 15. Dashboard of the workflow.

Fig. 16. Button for the detailed information.
ATTENTION: The running time is highly dependent on the dataset dimensions and the number of selected regions. For simulated datasets, the execution time is typically under a few minutes.
Workflow insight
Here you will find four panels:
1. General information includes several information regarding the workflow (Fig. 17).
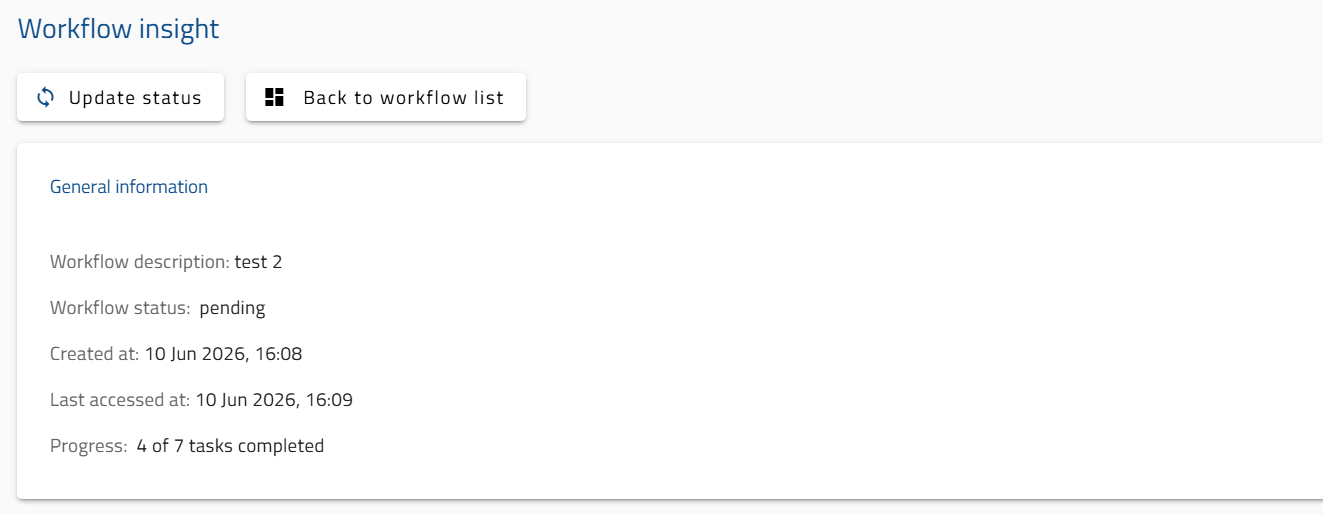
Fig. 17. Control panel dedicated to monitoring workflow status.
2. Workflow status diagram provides a clear visual overview of your workflow and individual service statuses (Fig. 18).
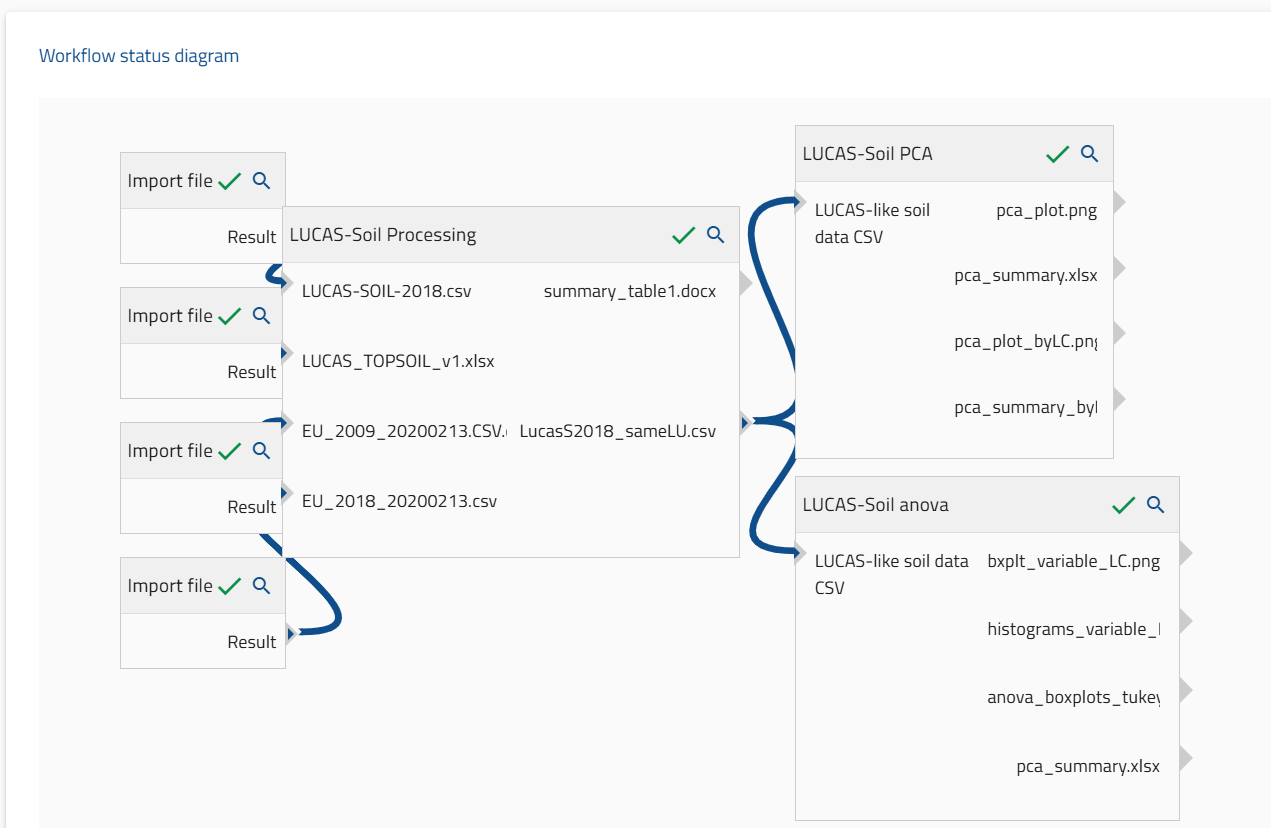
Fig.18. Workflow status diagram.
3. Workflow output files allows you to retrieve the results for all analysis (Fig. 19). Here you can find the individual outputs for each component of the workflow, as well as their text log files, and you can download them to your local hard disk or directly delete (Fig. 20).
- Within the ‘LucasSoilANOVA-6>mnt>outputs’ folder you will find all the outputs of the ANOVA.
- Within the ‘LucasSoilPCA-5>mnt>outputs’’ folder you will find all the outputs generated by the PCA.
- Within the ‘LucasSoilProcessing-4> mnt>outputs’’ folder you will find all the outputs generated during the LUCAS data and geographical data selection and exploration phase
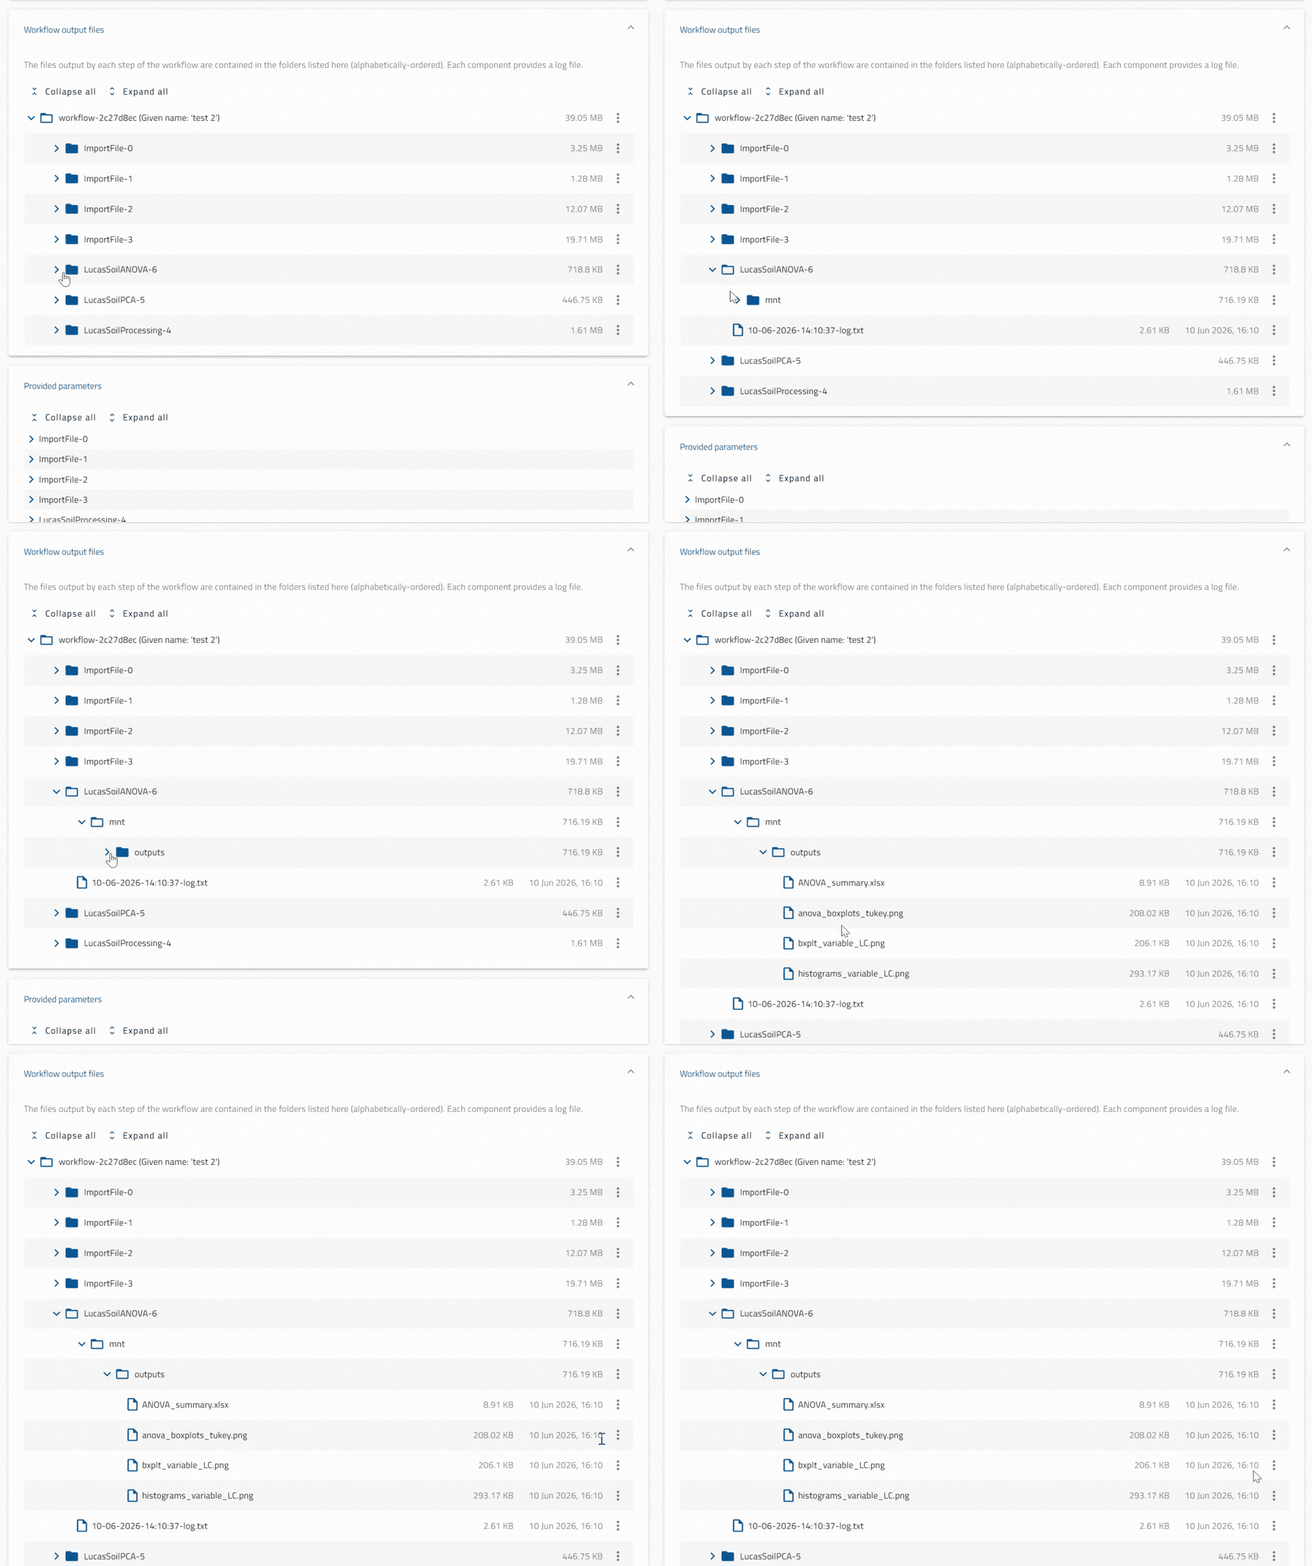
Fig. 20. By default, all folders are collapsed; however, they can be expanded by clicking the action toggle on the left. Expanding the folders allows access to the relevant outputs, which are available for individual download via the action column on the right.
4. Provided parameters allows you to view the details of the input files, the pre-processing phase, and the statistical analysis (Fig. 21). The folders are collapsed by default, but you can open them using the action toggle on the left.
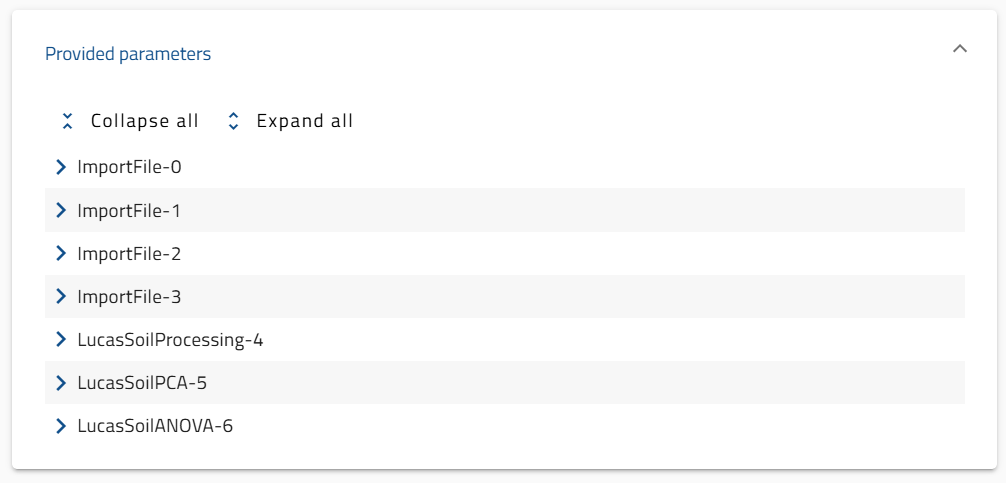
Fig. 21. Panel with the parameters provided by the VRE.