The output interpretation and test of robustness
Evaluate the robustness of the projections: the MESS index - Step 2/2
Now we can calculate the MESS index and plot the map
> MESS<-mess(X=vars_proj, V=extract(vars_training, dataset), full=F)
> color.high<-colorRampPalette(c("lightgrey","blue"))
> color.low<-colorRampPalette(c("red","lightgrey"))
> plot(MESS, col=c(color.low(abs(minValue(MESS))),color.high(maxValue(MESS))))
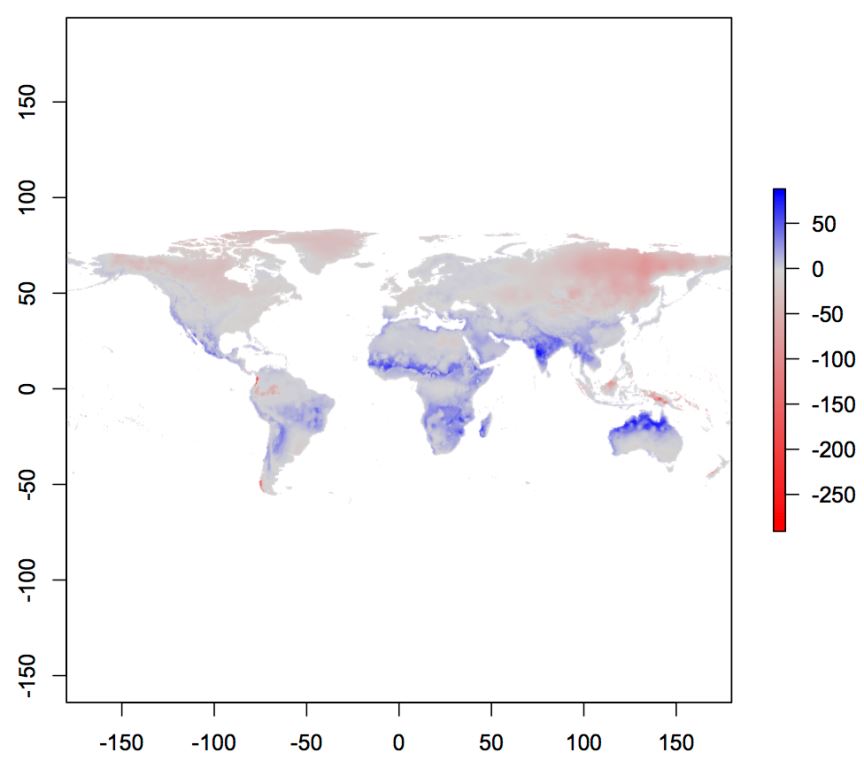
In the figure plot, the red values indicate areas where the extrapolation effect results more serious. According to this map most of the areas outside the native range where the probability to find a suitable area for the species is high (according to the ensemble models) is not affected by serious problems. However there are still many regions where the projection must be interpreted carefully.