The output interpretation and test of robustness
Obtaining the final model and Interpretation of the results - Step 6/6
Finally, a boxplot can be used to evaluate if the future predicted distribution would change its prevalent latitude. First of all, the rasterToPoints() function can be used to extract the coordinates of each raster cell for both the current and the future predicted distributions.
Then, it is necessary to extract just the latitudes of the cells with the species predicted as present and finally, to launch the boxplot.
> rtp_current<-rasterToPoints(b_current)
> rtp_current<-rtp_current[rtp_current[,3]==1,2]
> rtp_future<-rasterToPoints(b_future)
> rtp_future<-rtp_future[rtp_future[,3]==1,2]
> boxplot(list(rtp_current, rtp_future), col="grey", main="Latitude of predicted presence",
+names=c("Current", "Future"), ylab="decimal degrees")
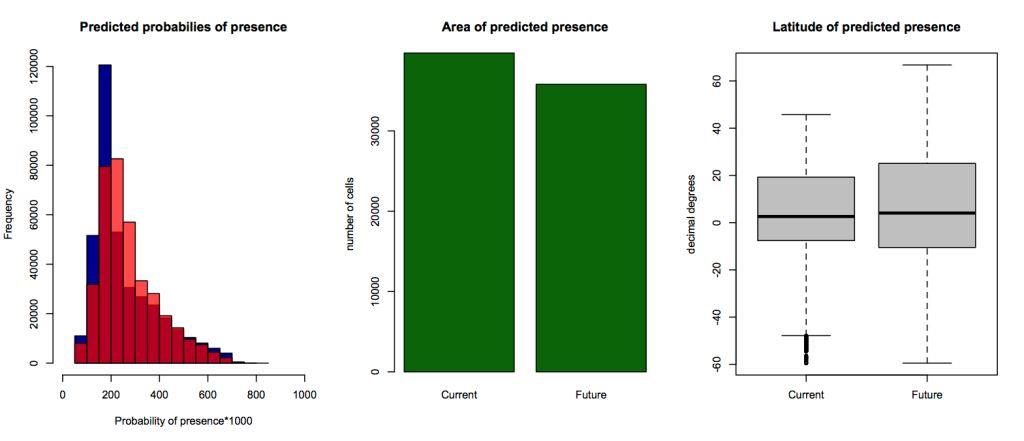
The first panel on the left of the figure above clearly shows how the probability values for the future climate (the red bars) result shifted toward higher values with respect of the current climate (the blue bars). Furthermore, the species will reduce its potential suitable habitat in the future (green histograms in the middle). Despite reduced new areas will became potentially hospitable for this species, especially in northern latitudes (boxplot on the right).