Running the analysis
Fit the models - Step 12/14
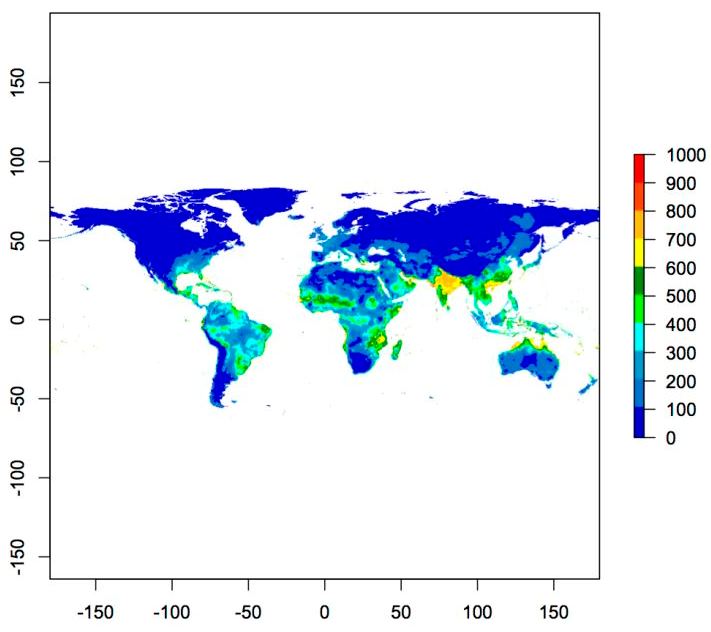
Let’s plot the resulting maps for the ensemble models obtained for projection at global scale under current and future climatic conditions:
> source("../script/palette_MAXENT.R")
> map.current<-stack("krameri.1/proj_current/proj_current_krameri.1_ensemble.gri")
> plot(map.current[[2]], col=palette_MAXENT(min=0, max=1000, interval=100)[[1]], breaks=palette_MAXENT(0, 1000, 100)[[2]])