Running the analysis
Fit the models - Step 8/14
and finally plot 4 maps (only from the first run):
> source("../script/palette_MAXENT.R")
> map.current<-stack("krameri.1/proj_current/proj_current_krameri.1.gri")
> plot(map.current[[c(1,2,3,4)]], col=palette_MAXENT(min=0, max=1000, interval=100)[[1]], breaks=palette_MAXENT(0, 1000, 100)[[2]])
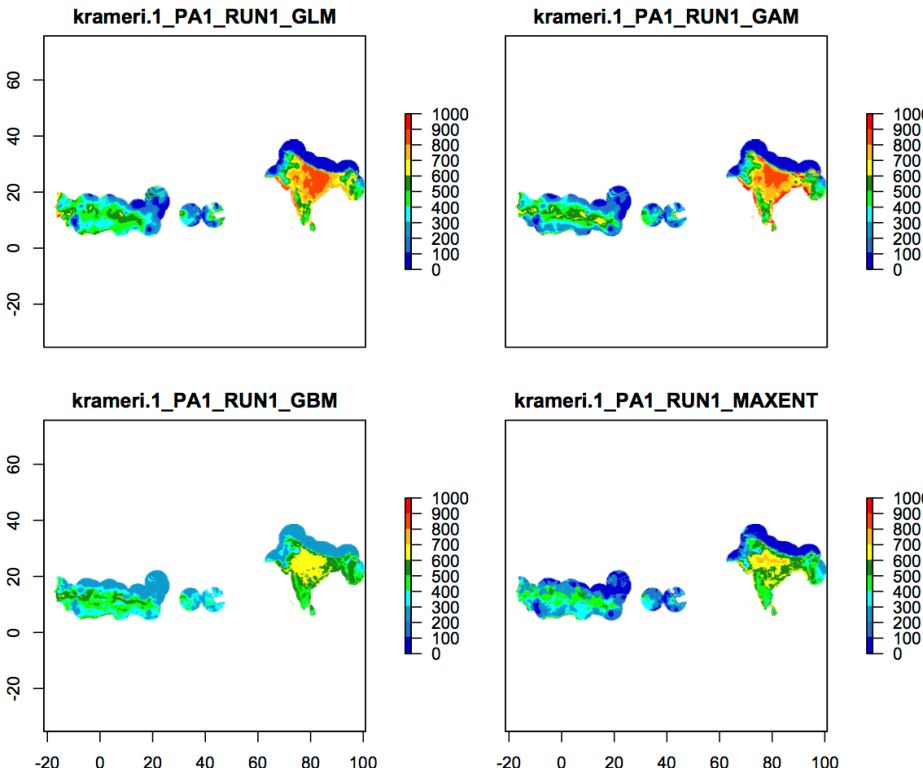
The figure report the projections for the four models in the training area. As you can see the four models are similar in identify areas with higher and lower probability of presence but the probability associated to these areas can differ largely among models.