Occurence data
Visual check and filtering of data with IUCN EOOs Step 1/4
The next step is to visually inspect the dataset plotting the occurrences on a map (Figure 1):
> library(maptools)
> data(wrld_simpl)
> plot(wrld_simpl)
> points(krameri$lon,krameri$lat, pch=21, bg="red",cex=0.5)
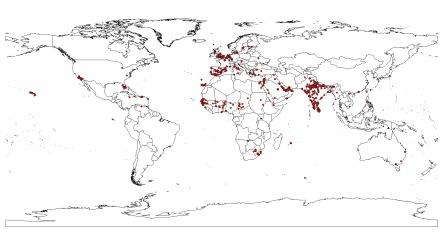
Figure 1.1: A map showing the occurences of P. krameri downloaded from GBIF.